- 미국·이스라엘-이란 전쟁 관련 인식 - Gallup International 다국가 조사 #중동
- 조사일 : 2026/03/31
- [GallupReport(20260410)_IranSnapPoll_GIA.pdf] 다운로드
● 2026년 4월 10일(금) 공개, 14일(화) 업데이트 | 문의: 02-3702-2571/2621/2622
미국·이스라엘-이란 전쟁 관련 인식: Gallup International 다국가 조사
→ 한국 교차집계표 다운로드(PDF)
→ 15개국 조사 결과 전체 보기 & 파일
/ 세계 조사 개요
2026년 3월 15개국 성인 총 12,909명 CAWI/CATI(웹조사/전화조사)
/ 한국 조사 개요
· 조사기간: 2026년 3월 19~26일
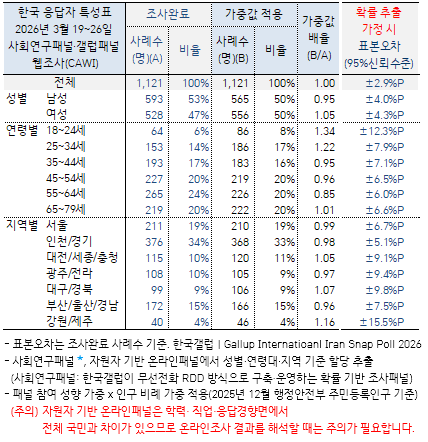
· 표본추출: 사회연구패널★, 자원자 기반 온라인패널에서 성별·연령대·지역 할당 추출
(한국갤럽이 무선전화 RDD 방식으로 구축·운영하는 확률 기반 조사패널)
· 응답방식: CAWI(조사대상자에게 문자메시지·이메일 발송, 자기기입식 웹조사)
· 조사대상: 전국 만 18~79세 1,121명
· 표본오차: ±2.9%포인트(확률 추출 가정 시, 95% 신뢰수준)
· 조사 요청 대비 응답 완료율: 14.0%(총 8,017명 중 1,121명)
· 의뢰처: 한국갤럽-Gallup International 자체 조사
/ 조사 항목(아래 순서대로 질문, 화살표(→) 옆 단어 클릭하면 해당 위치로 이동)
→ 이번 전쟁에서 지지하는 진영
→ 신체적, 재정적, 정서적 측면 개인 피해
→ 예상 승전국 | → 전쟁 발발 책임 소재 | → 이란 최고 지도자 암살
→ 자국 정부 전쟁 대응 평가 | → 주요 9개국 전쟁 대응 평가
→ 이란 정부 교체 성패 | → 전후 이란/중동/이스라엘 상황
→ 전쟁 지속 기간
→ (EU 일부 한정) 미국 군사적 지원, 자국 내 테러 가능성
→ (영문) Gallup International commentary
→ 한국 응답자 특성표
요약
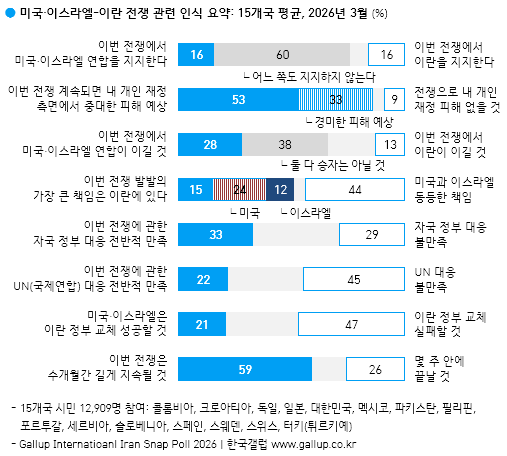
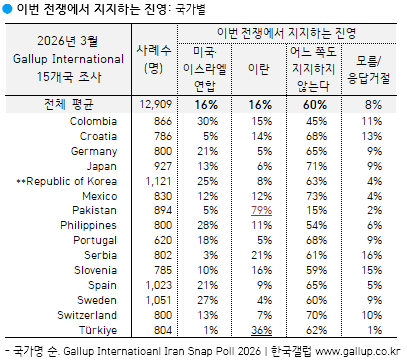
[지지하는 진영] 15개국 시민 60% '어느 쪽도 지지하지 않는다', 미국·이스라엘 연합, 이란 지지 각각 16%
[전쟁 영향] 개인 재정 측면에서 '중대한 피해 예상' 53%, '경미한 피해' 33%, '피해 없을 것' 9%
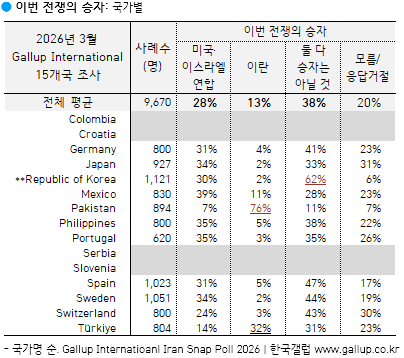
[예상 승전국] '둘 다 승자는 아닐 것' 38%, '미국·이스라엘 연합' 28%, '이란' 13%
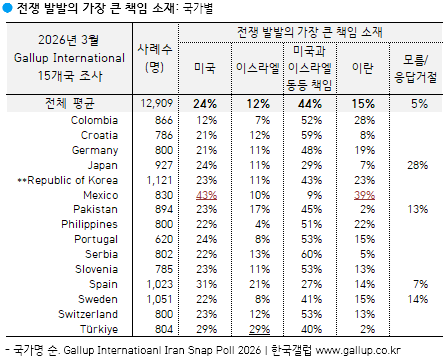
[전쟁 발발 책임] '이란' 15% - '미국·이스라엘 동등 책임' 44%, '미국' 24%, '이스라엘' 12%
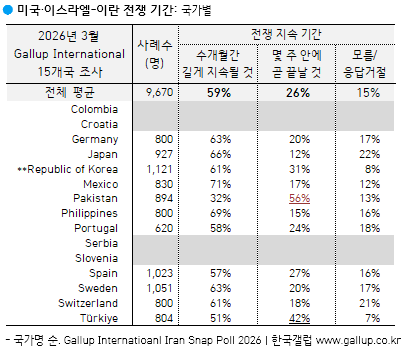
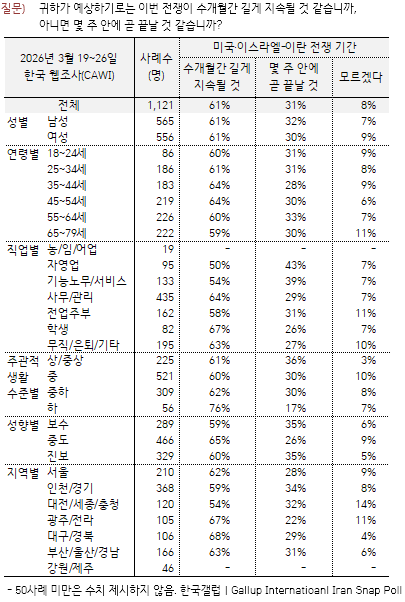
[전쟁 기간] '수개월간 길게 지속될 것' 59%, '몇 주 안에 끝날 것' 26%
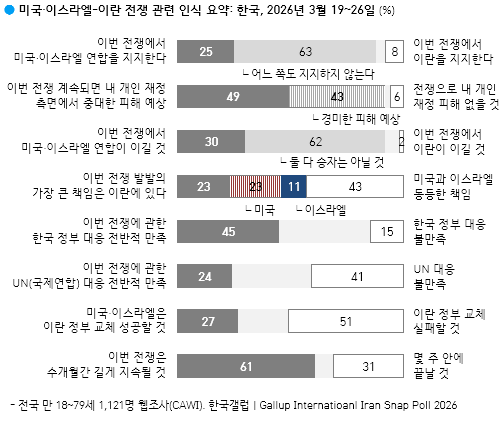
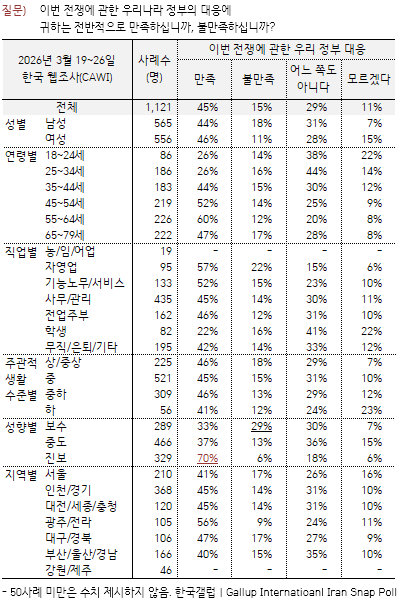
[한국] 대체로 15개국 평균 수준, 일부 주제에는 정치적 성향별 견해차 큰 편
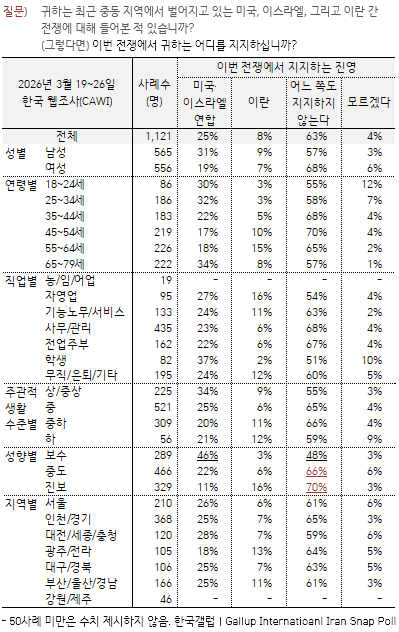
· 성향 보수층 절반가량(46%) 미국·이스라엘 연합 지지; 중도층 22%, 진보층 11%
· 보수층 42%는 전쟁 발발 책임이 이란에 있다고 봐; 중도층 22%, 진보층 8%
조사 결과
2026년 3월 15개국 시민 60%, '이번 전쟁에서 어느 쪽도 지지하지 않아'
- 미국·이스라엘 연합, 이란 지지 각각 16%
갤럽 인터내셔널이 2026년 3월 15개국(콜롬비아, 크로아티아, 독일, 일본, 한국, 멕시코, 파키스탄, 필리핀, 포르투갈, 세르비아, 슬로베니아, 스페인, 스웨덴, 스위스, 튀르키예) 성인 12,909명에게 미국·이스라엘-이란 전쟁에서 어느 진영을 지지하는지 물었다. 그 결과 60%가 '어느 쪽도 지지하지 않는다'라고 답했고, 미국·이스라엘 연합과 이란 지지 각각 16%로 나타났다. 8%는 의견을 유보했다. 파키스탄에서는 이란 지지가 79%에 달했지만, 나머지 14개국에서는 어느 편도 들지 않는다는 것이 중론이다. 미국·이스라엘 연합 지지세가 매우 강한 나라는 없었다(콜롬비아 30%, 필리핀 28%, 스웨덴 27%, 한국 25% 순).
'전쟁 발발은 미국·이스라엘 책임' 80%, '이란' 15%
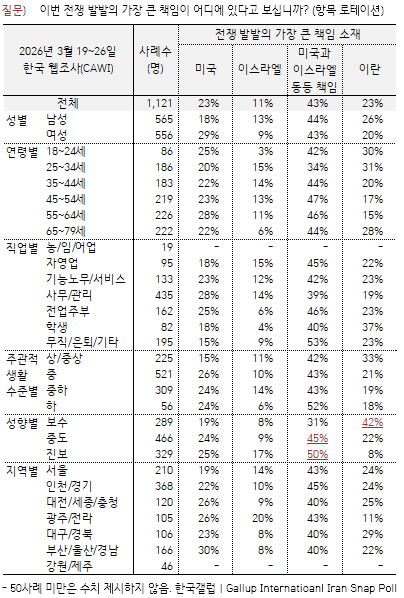
15개국 시민 중 80%가 전쟁 발발의 가장 큰 책임이 미국·이스라엘 측에 있다고 봤고('미국·이스라엘 동등' 44%, '미국' 24%, '이스라엘' 12%), 15%만 이란을 지목했다. 한국인은 77%가 미국·이스라엘(43%, 23%, 11%), 23%가 이란 책임이라고 여겼다. 다만 한국의 이란 귀책론 기준으로 보면 보수층 42%, 중도층 22%, 진보층 8%로 정치적 성향별 견해차가 큰 편이다. 선행 질문에서도 보수층에서는 46%가 이번 전쟁에서 미국·이스라엘 연합을 지지하지만, 중도층에서는 그 비율이 22%, 진보층에서는 11%에 그친다.
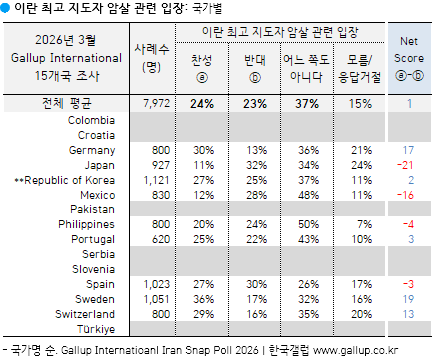
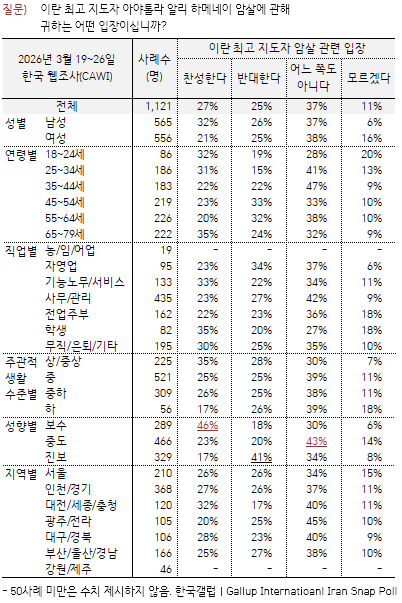
◎ 이란 최고 지도자 아야톨라 알리 하메네이 암살에 관한 9개국(독일, 일본, 한국, 멕시코, 필리핀, 포르투갈, 스페인, 스웨덴, 스위스) 시민의 입장은 찬반이 각각 24%, 23%로 비슷하며 나머지는 의견을 유보했다('어느 쪽도 아니다' 37%, '모름/응답거절' 15%). 한국인 역시 전체 찬반은 비슷한데(27%, 25%), 정치적 성향별로는 보수층 46% 찬성, 진보층 41% 반대로 견해를 달리했다.
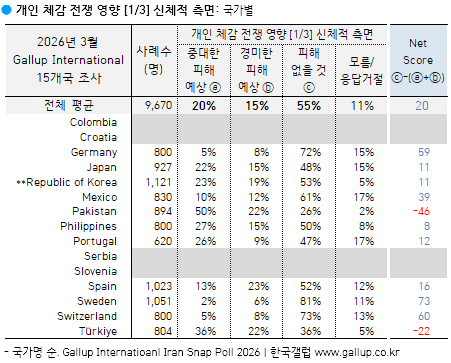
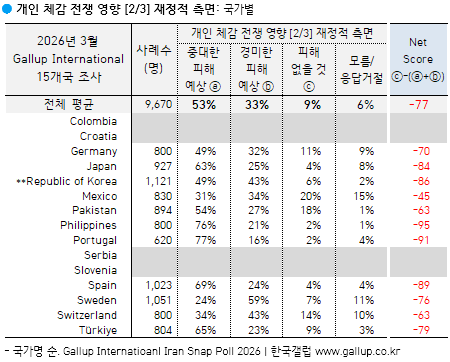
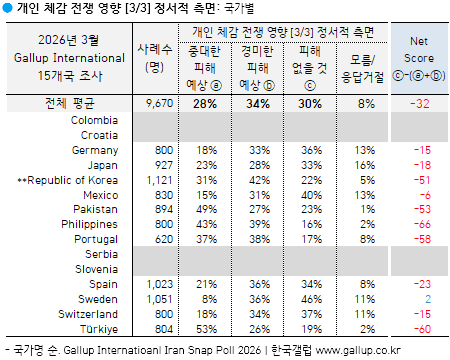
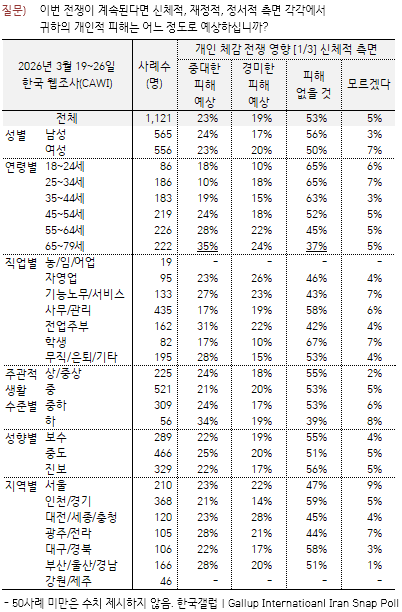
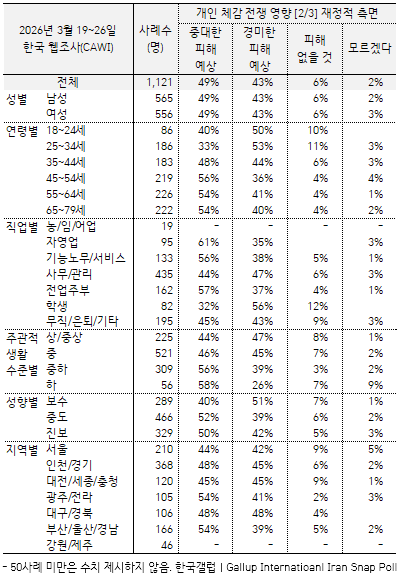
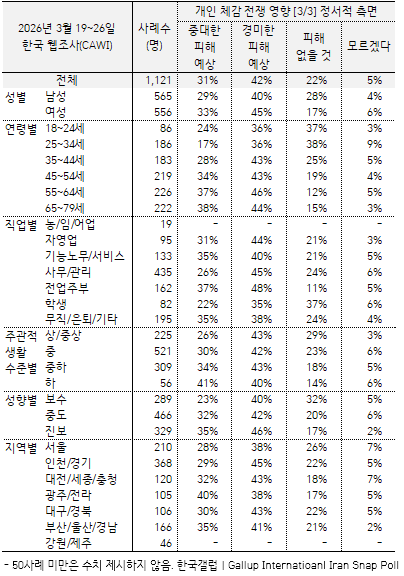
전쟁 장기화에 따른 재정적(86%), 정서적(62%), 신체적(35%) 피해 우려
11개국(독일, 일본, 한국, 멕시코, 파키스탄, 필리핀, 포르투갈, 스페인, 스웨덴, 스위스, 튀르키예) 시민 중 86%가 이번 전쟁이 계속되면 개인의 재정적 피해(중대 53%, 경미 33%)가 예상된다고 답했고, 62%는 정서적 피해(중대 28%, 경미 34%), 35%는 신체적 피해(중대 20%, 경미 15%)도 우려했다. 재정적 피해는 11개국 공통, 신체적 영향은 파키스탄과 튀르키예에서 두드러졌다.
끝나더라도 승자 없이 상흔만 남는 전쟁 예상
미국과 이스라엘이 원하는 대로 이란 정부 교체될 것으로 보지 않아
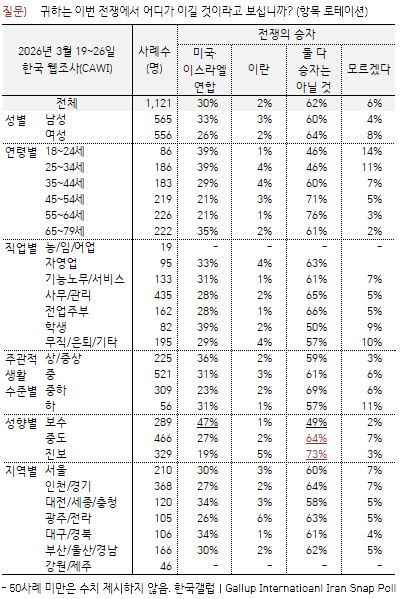
이번 전쟁에서 어디가 이길 것이라고 보는가 하는 질문에는 11개국 시민 중 38%가 '둘 다 승자는 아닐 것', 28%는 미국·이스라엘 연합, 13%는 이란을 지목했다. 20%는 의견을 유보했다. 파키스탄에서는 76%, 튀르키예도 32%가 이란 승리를 내다봤으나, 이외 9개국에서는 이란보다 미국·이스라엘 연합으로 기울었다. 둘 다 승자가 아닐 것이란 시각은 한국에서 62%로 가장 많았다.
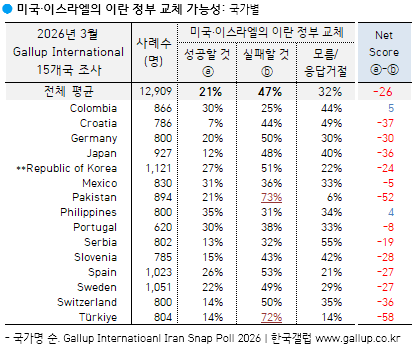
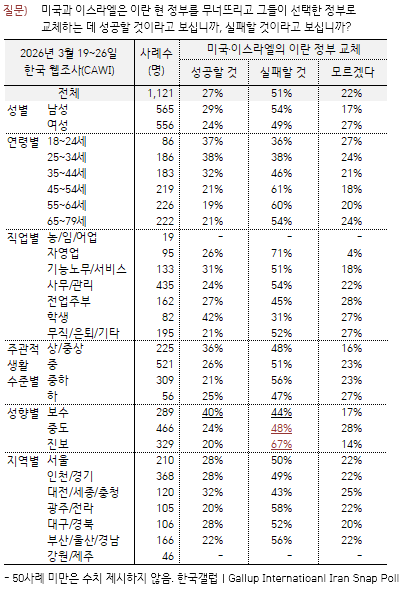
◎ 미국과 이스라엘의 이란 정부 교체 가능성에 관해서는 15개국 시민 중 47%가 '실패할 것', 21%만 '성공할 것'으로 예상했다. 32%는 의견을 유보했다. 콜롬비아, 필리핀, 포르투갈 등에서는 성패론이 비슷하게 갈렸지만, 이외 12개국 대부분 실패 예상이 우세하고 파키스탄과 튀르키예에서는 그 비율이 70%를 웃돌았다.
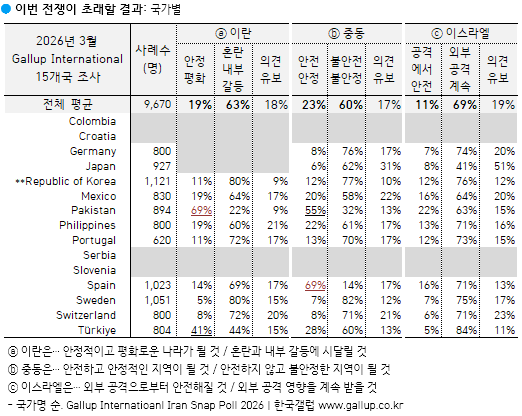
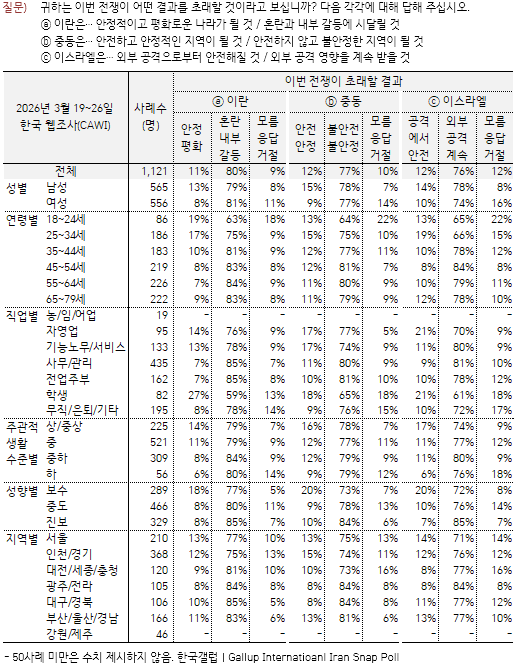
◎ 이번 전쟁이 이란, 중동, 이스라엘 각각에 초래할 결과에 관한 전망은 대체로 암울하다. 먼저 이란 전후 상황은 '안정적이고 평화로운 나라가 될 것' 19%, '혼란과 내부 갈등에 시달릴 것' 63%, 중동은 '안전하고 안정적인 지역이 될 것' 23%, '안전하지 않고 불안정한 지역이 될 것' 60%, 이스라엘은 '외부 공격으로부터 안전해질 것' 11%, '외부 공격 영향을 계속 받을 것' 69%로 나타났다. 파키스탄에서는 이란과 중동의 전후 상황에 비교적 낙관적이며, 스페인도 중동이 안전하고 안정될 것으로 보지만 조사 참여국 다수에서는 비관론이 앞선다.
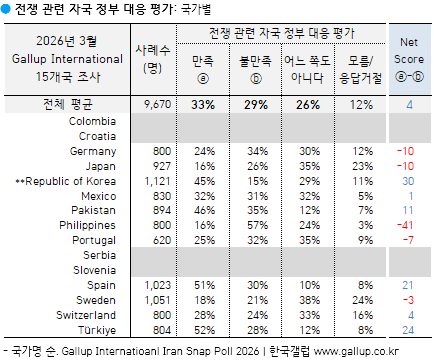
자국 정부의 전쟁 대응 평가: 한국, 튀르키예, 스페인 긍정적
자국 정부 평가와 별개로 UN과 러시아에는 불만족
11개국 시민의 이번 전쟁 관련 자국 정부 대응 평가는 만족(33%)과 불만족(29%)이 비슷하게 갈렸다. 자국 정부 전쟁 대응 평가 순지수(Net Score: 만족-불만족 응답 차이, 수치가 클수록 만족) 기준으로 보면 한국 +30, 튀르키예 +24, 스페인 +21, 파키스탄 +11 순으로 높고, 필리핀이 -41로 가장 낮다.
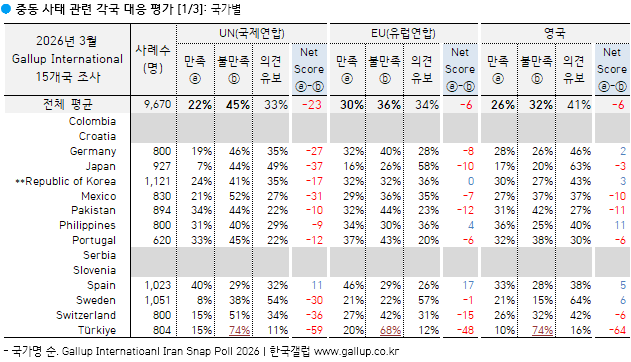
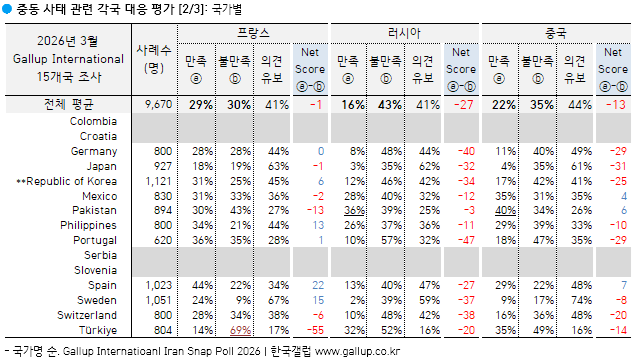
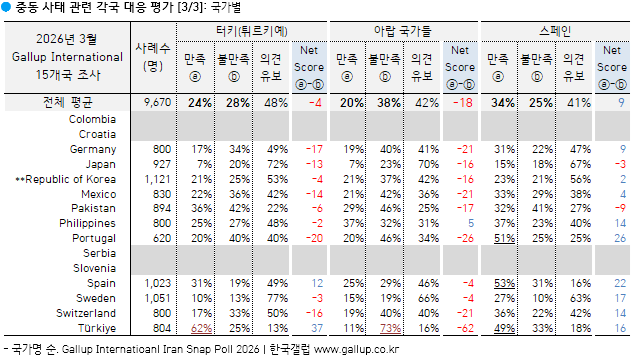
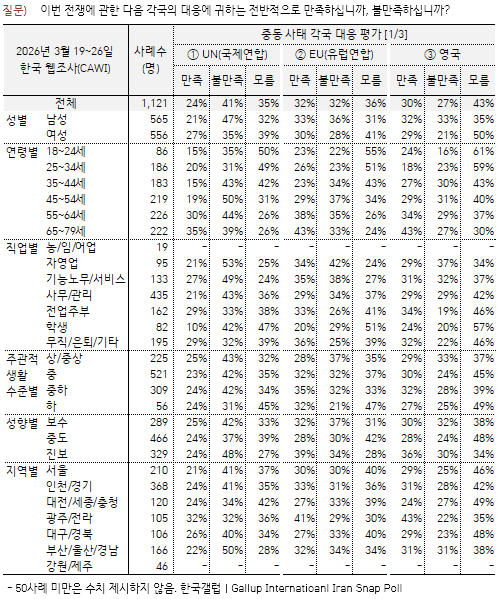
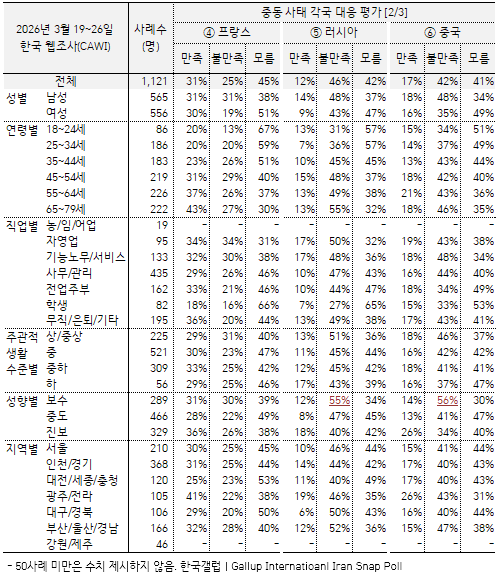
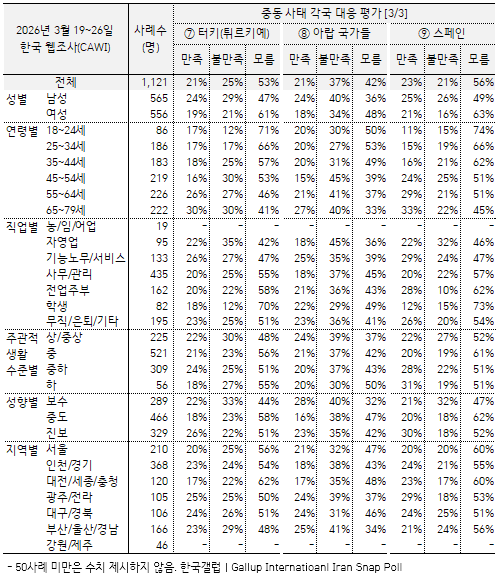
◎ 자국 정부와는 별개로 UN(국제연합), EU(유럽연합)을 비롯한 주요국 전쟁 대응에 관한 11개국 시민의 평가는 순지수 기준 스페인 +9, 프랑스 -1, 튀르키예 -4, EU와 영국 각각 -6, 중국 -13, 아랍 국가들 -18, UN -23, 러시아 -27이다. 이는 전쟁 상황에서 뚜렷한 존재감을 보이지 못하는 UN, 이미 우크라이나와 장기전 중인 러시아에 대한 반감으로 읽힌다. 현재 중재 역할을 하고 있는 파키스탄에서는 국가별 대응 평가가 엇비슷하고, 튀르키예에서는 UN, EU, 영국, 프랑스, 아랍 국가들 등에 불만이 큰 특징을 보였다.
유럽 3국 시민, 자국 정부나 EU의 미국 군사적 지원에 반대
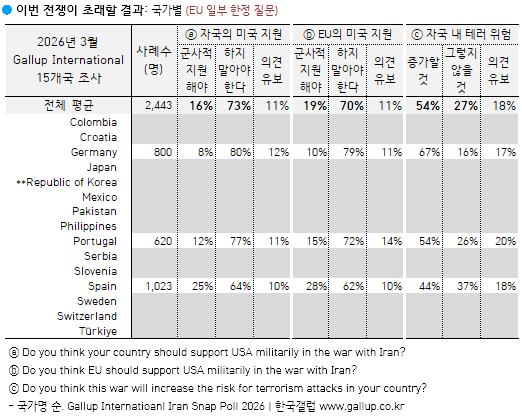
끝으로, 독일, 포르투갈, 스페인 3개국에 한해서는 미국 국사적 지원과 자국 내 테러 증가 가능성에 관해서도 물었다. 자국의 미국 군사적 지원에는 찬성 16%, 반대 73%, EU의 미국 군사적 지원에는 찬성 19%, 반대 70%, 그리고 자국 내 테러 위험이 증가할 것이라는 데 54%가 동의, 27%는 비동의했다.
───
이번 전쟁에서 지지하는 진영
───
신체적, 재정적, 정서적 측면 개인 피해
───
예상 승전국
───
전쟁 발발 책임 소재
───
이란 최고 지도자 암살
───
자국 정부 전쟁 대응 평가
───
주요 9개국 전쟁 대응 평가
───
이란 정부 교체 성패
───
전후 이란/중동/이스라엘 상황
───
전쟁 지속 기간
───
(EU 일부 한정) 미국 군사적 지원, 자국 내 테러 가능성
──────────────────
Iran Conflict: Public Opinion Leaves U.S. Isolated
— Blamed for War, Little Faith in Outcomes, and Widespread Economic Concern
──────────────────
Publics Fear Economic Fallout (85%) and See No Quick End (59%)
— While 80% Blame USA/Israel, Most Refuse to Take Sides (60%)
The Gallup International Association has released findings from a new multi-country snap poll on the ongoing war involving the USA, Israel and Iran, revealing a striking global pattern: among those aware of the conflict, most people are unwilling to take sides, believe the war will lead to instability, doubt that regime change will succeed, expect a prolonged conflict, and widely see the USA and Israel as responsible for initiating the war.
The survey was conducted across 15 countries with a total sample of approximately 13,000 respondents.
This is the first multi-country snapshots of public opinion on the Iran conflict, captured in real time through a coordinated effort by professional pollsters. Gallup International Association has a legacy of conducting similar multi-country surveys at rapid pace to inform policy makers on what publics around the world are thinking as conflicts unfold.
Most Refuse to Take Sides (60%)
Across countries, the dominant public response is not support for either side, but distance. A clear majority, 60% say they support neither side, compared to 16% who support the USA–Israel coalition and 16% who support Iran.
Support for Iran is highest in Pakistan at 79%, followed by Türkiye at 36%. Support for USA-Israel alliance is highest in Colombia at 30%, followed by Philippines (28%).
Many Blame the USA and Israel for starting the war (44% Equal Responsibility; 80% Combined Attribution)
On the question of responsibility, the most common global view is that the USA and Israel are equally responsible, cited by 44% of respondents. 24% blame the USA alone,12% blame Israel alone, while15% blame Iran. Taken together, 80% attribute responsibility at least partly to the USA and Israel.
Regime Change Widely Seen as Unlikely (47% Fail vs 21% Succeed)
Publics are skeptical that war will achieve one of its key potential objectives. 47% believe efforts to replace Iran’s government will fail, 21% believe they will succeed, 32% remain uncertain.
World Expects Turmoil (63% Iran Chaos; 60% Regional Instability; 69% Continued Threats to Israel)
Across outcomes, the global public expects instability. 63% expect chaos and internal strife in Iran, 60% believe the Middle East will become more unstable, 69% think Israel will continue to face external attacks.
A Long War is Expected (59% Say Many Months vs 26% Weeks)
59% expect the war to last many months, 26% expect it to end within weeks.
Economic Impact is Nearly Universal
53% expect strong financial harm, 33% expect minor financial harm, while only 9% expect no harm. Detailed findings can be found on Gallup International website.
Commentary from Gallup International Association team which led this first multi-country poll on Iran Conflict: This multi-country survey shows large majorities believe the United States and Israel have initiated a war that is unlikely to end soon, is not expected to lead to regime change, and is seen as causing significant economic harm without delivering greater security for Israel or stability in the Middle East. Across countries, including traditional allies, publics increasingly see the United States as standing alone in its narrative on the conflict. While they may not align with Iran, they are clearly not aligning with the U.S. either.
Methodology
The study was conducted by the Gallup International Association with a total sample of approximately 13,000 respondents across 15 countries. The survey covers a diverse set of countries, with an average sample of around 850 respondents per country. The findings are based on adults who reported being aware of the war. Data were collected using nationally representative approaches, employing a mix of online and telephone interviews depending on country context. In some countries, non-probability online panels were used; further details on these approaches are provided in the full methodology note. Data were weighted to reflect national population characteristics, and global results are computed as averages across countries. Fieldwork for the study was conducted between 5th March and 30th March 2026.
Note: Across the 15 countries covered in this study, nationally representative samples were achieved in 14 countries, while 1 country had more limited or non-national coverage due to methodological constraints in terms of sampling design.
Out of 15 countries, 8 used probability-based sampling, 5 used quota sampling, and 2 relied on non-probability samples. Here is list of countries with relevant methods used: Random Probability (8 countries): Croatia, Germany, Pakistan, Serbia, Slovenia, Sweden, Switzerland, and Türkiye; Quota Sampling (5 countries): Colombia, Japan, Portugal, Republic of Korea, and Spain; Non-Probability Sample (2 countries): Mexico and Philippines.
Given the use of non-probability sampling, a conventional margin of error is not reported, as it is not strictly applicable in such designs. Accordingly, the findings should be interpreted with appropriate caution and viewed as indicative of public sentiment rather than precise population estimates, particularly when making cross-country comparisons.
───
한국 응답자 특성표
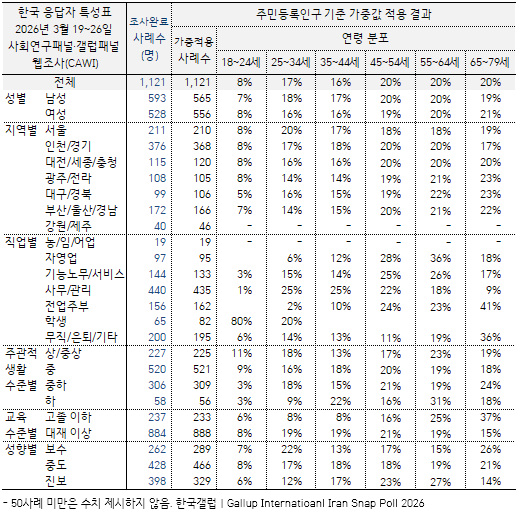
| ● 1947년 조지 갤럽 박사가 설립한 갤럽 인터내셔널(Gallup International Association)은 1977년부터 전 세계 회원사들이 매년 말 자국민을 대상으로 경제, 노동, 국제 관계 인식과 새해 전망을 알아보는 〈End of Year Survey〉 외 인간 가치관, AIDS, UN 활동, 아프가니스탄 침공, 9.11 테러, 세계 경제 위기, 일본 대지진, 코로나19, 글로벌 리더, 미국 대통령선거 등 주요 현안에 관한 다국가 비교 조사를 하고 있습니다. 한국갤럽은 1979년부터 함께합니다. → Press release for the 120th Anniversary of Dr. George Gallup ● 현재 미국과 이스라엘이 이란을 상대로 전쟁 중인데요. 종전 협상은 난항 중입니다. 그 여파로 우리나라를 비롯한 많은 나라가 석유 등 자원 수급에 어려움을 겪고, 시민의 삶도 적잖이 영향받고 있습니다. 2026년 3월, 갤럽 인터내셔널이 전쟁 당사국을 제외한 15개국 시민에게 이번 전쟁을 어떻게 보는지 긴급 조사를 진행했습니다. 중재 역할을 하고 있는 파키스탄, EU, 미국 인접국 등에서의 여론을 가늠해 보시기 바랍니다. |
미국·이스라엘-이란 전쟁 관련 인식: Gallup International 다국가 조사
→ 한국 교차집계표 다운로드(PDF)
→ 15개국 조사 결과 전체 보기 & 파일
/ 세계 조사 개요
2026년 3월 15개국 성인 총 12,909명 CAWI/CATI(웹조사/전화조사)
/ 한국 조사 개요
· 조사기간: 2026년 3월 19~26일
· 표본추출: 사회연구패널★, 자원자 기반 온라인패널에서 성별·연령대·지역 할당 추출
(한국갤럽이 무선전화 RDD 방식으로 구축·운영하는 확률 기반 조사패널)
· 응답방식: CAWI(조사대상자에게 문자메시지·이메일 발송, 자기기입식 웹조사)
· 조사대상: 전국 만 18~79세 1,121명
· 표본오차: ±2.9%포인트(확률 추출 가정 시, 95% 신뢰수준)
· 조사 요청 대비 응답 완료율: 14.0%(총 8,017명 중 1,121명)
· 의뢰처: 한국갤럽-Gallup International 자체 조사
/ 조사 항목(아래 순서대로 질문, 화살표(→) 옆 단어 클릭하면 해당 위치로 이동)
→ 이번 전쟁에서 지지하는 진영
→ 신체적, 재정적, 정서적 측면 개인 피해
→ 예상 승전국 | → 전쟁 발발 책임 소재 | → 이란 최고 지도자 암살
→ 자국 정부 전쟁 대응 평가 | → 주요 9개국 전쟁 대응 평가
→ 이란 정부 교체 성패 | → 전후 이란/중동/이스라엘 상황
→ 전쟁 지속 기간
→ (EU 일부 한정) 미국 군사적 지원, 자국 내 테러 가능성
→ (영문) Gallup International commentary
→ 한국 응답자 특성표
요약
[지지하는 진영] 15개국 시민 60% '어느 쪽도 지지하지 않는다', 미국·이스라엘 연합, 이란 지지 각각 16%
[전쟁 영향] 개인 재정 측면에서 '중대한 피해 예상' 53%, '경미한 피해' 33%, '피해 없을 것' 9%
[예상 승전국] '둘 다 승자는 아닐 것' 38%, '미국·이스라엘 연합' 28%, '이란' 13%
[전쟁 발발 책임] '이란' 15% - '미국·이스라엘 동등 책임' 44%, '미국' 24%, '이스라엘' 12%
[전쟁 기간] '수개월간 길게 지속될 것' 59%, '몇 주 안에 끝날 것' 26%
[한국] 대체로 15개국 평균 수준, 일부 주제에는 정치적 성향별 견해차 큰 편
· 성향 보수층 절반가량(46%) 미국·이스라엘 연합 지지; 중도층 22%, 진보층 11%
· 보수층 42%는 전쟁 발발 책임이 이란에 있다고 봐; 중도층 22%, 진보층 8%
조사 결과
2026년 3월 15개국 시민 60%, '이번 전쟁에서 어느 쪽도 지지하지 않아'
- 미국·이스라엘 연합, 이란 지지 각각 16%
갤럽 인터내셔널이 2026년 3월 15개국(콜롬비아, 크로아티아, 독일, 일본, 한국, 멕시코, 파키스탄, 필리핀, 포르투갈, 세르비아, 슬로베니아, 스페인, 스웨덴, 스위스, 튀르키예) 성인 12,909명에게 미국·이스라엘-이란 전쟁에서 어느 진영을 지지하는지 물었다. 그 결과 60%가 '어느 쪽도 지지하지 않는다'라고 답했고, 미국·이스라엘 연합과 이란 지지 각각 16%로 나타났다. 8%는 의견을 유보했다. 파키스탄에서는 이란 지지가 79%에 달했지만, 나머지 14개국에서는 어느 편도 들지 않는다는 것이 중론이다. 미국·이스라엘 연합 지지세가 매우 강한 나라는 없었다(콜롬비아 30%, 필리핀 28%, 스웨덴 27%, 한국 25% 순).
'전쟁 발발은 미국·이스라엘 책임' 80%, '이란' 15%
15개국 시민 중 80%가 전쟁 발발의 가장 큰 책임이 미국·이스라엘 측에 있다고 봤고('미국·이스라엘 동등' 44%, '미국' 24%, '이스라엘' 12%), 15%만 이란을 지목했다. 한국인은 77%가 미국·이스라엘(43%, 23%, 11%), 23%가 이란 책임이라고 여겼다. 다만 한국의 이란 귀책론 기준으로 보면 보수층 42%, 중도층 22%, 진보층 8%로 정치적 성향별 견해차가 큰 편이다. 선행 질문에서도 보수층에서는 46%가 이번 전쟁에서 미국·이스라엘 연합을 지지하지만, 중도층에서는 그 비율이 22%, 진보층에서는 11%에 그친다.
◎ 이란 최고 지도자 아야톨라 알리 하메네이 암살에 관한 9개국(독일, 일본, 한국, 멕시코, 필리핀, 포르투갈, 스페인, 스웨덴, 스위스) 시민의 입장은 찬반이 각각 24%, 23%로 비슷하며 나머지는 의견을 유보했다('어느 쪽도 아니다' 37%, '모름/응답거절' 15%). 한국인 역시 전체 찬반은 비슷한데(27%, 25%), 정치적 성향별로는 보수층 46% 찬성, 진보층 41% 반대로 견해를 달리했다.
전쟁 장기화에 따른 재정적(86%), 정서적(62%), 신체적(35%) 피해 우려
11개국(독일, 일본, 한국, 멕시코, 파키스탄, 필리핀, 포르투갈, 스페인, 스웨덴, 스위스, 튀르키예) 시민 중 86%가 이번 전쟁이 계속되면 개인의 재정적 피해(중대 53%, 경미 33%)가 예상된다고 답했고, 62%는 정서적 피해(중대 28%, 경미 34%), 35%는 신체적 피해(중대 20%, 경미 15%)도 우려했다. 재정적 피해는 11개국 공통, 신체적 영향은 파키스탄과 튀르키예에서 두드러졌다.
끝나더라도 승자 없이 상흔만 남는 전쟁 예상
미국과 이스라엘이 원하는 대로 이란 정부 교체될 것으로 보지 않아
이번 전쟁에서 어디가 이길 것이라고 보는가 하는 질문에는 11개국 시민 중 38%가 '둘 다 승자는 아닐 것', 28%는 미국·이스라엘 연합, 13%는 이란을 지목했다. 20%는 의견을 유보했다. 파키스탄에서는 76%, 튀르키예도 32%가 이란 승리를 내다봤으나, 이외 9개국에서는 이란보다 미국·이스라엘 연합으로 기울었다. 둘 다 승자가 아닐 것이란 시각은 한국에서 62%로 가장 많았다.
◎ 미국과 이스라엘의 이란 정부 교체 가능성에 관해서는 15개국 시민 중 47%가 '실패할 것', 21%만 '성공할 것'으로 예상했다. 32%는 의견을 유보했다. 콜롬비아, 필리핀, 포르투갈 등에서는 성패론이 비슷하게 갈렸지만, 이외 12개국 대부분 실패 예상이 우세하고 파키스탄과 튀르키예에서는 그 비율이 70%를 웃돌았다.
◎ 이번 전쟁이 이란, 중동, 이스라엘 각각에 초래할 결과에 관한 전망은 대체로 암울하다. 먼저 이란 전후 상황은 '안정적이고 평화로운 나라가 될 것' 19%, '혼란과 내부 갈등에 시달릴 것' 63%, 중동은 '안전하고 안정적인 지역이 될 것' 23%, '안전하지 않고 불안정한 지역이 될 것' 60%, 이스라엘은 '외부 공격으로부터 안전해질 것' 11%, '외부 공격 영향을 계속 받을 것' 69%로 나타났다. 파키스탄에서는 이란과 중동의 전후 상황에 비교적 낙관적이며, 스페인도 중동이 안전하고 안정될 것으로 보지만 조사 참여국 다수에서는 비관론이 앞선다.
자국 정부의 전쟁 대응 평가: 한국, 튀르키예, 스페인 긍정적
자국 정부 평가와 별개로 UN과 러시아에는 불만족
11개국 시민의 이번 전쟁 관련 자국 정부 대응 평가는 만족(33%)과 불만족(29%)이 비슷하게 갈렸다. 자국 정부 전쟁 대응 평가 순지수(Net Score: 만족-불만족 응답 차이, 수치가 클수록 만족) 기준으로 보면 한국 +30, 튀르키예 +24, 스페인 +21, 파키스탄 +11 순으로 높고, 필리핀이 -41로 가장 낮다.
◎ 자국 정부와는 별개로 UN(국제연합), EU(유럽연합)을 비롯한 주요국 전쟁 대응에 관한 11개국 시민의 평가는 순지수 기준 스페인 +9, 프랑스 -1, 튀르키예 -4, EU와 영국 각각 -6, 중국 -13, 아랍 국가들 -18, UN -23, 러시아 -27이다. 이는 전쟁 상황에서 뚜렷한 존재감을 보이지 못하는 UN, 이미 우크라이나와 장기전 중인 러시아에 대한 반감으로 읽힌다. 현재 중재 역할을 하고 있는 파키스탄에서는 국가별 대응 평가가 엇비슷하고, 튀르키예에서는 UN, EU, 영국, 프랑스, 아랍 국가들 등에 불만이 큰 특징을 보였다.
유럽 3국 시민, 자국 정부나 EU의 미국 군사적 지원에 반대
끝으로, 독일, 포르투갈, 스페인 3개국에 한해서는 미국 국사적 지원과 자국 내 테러 증가 가능성에 관해서도 물었다. 자국의 미국 군사적 지원에는 찬성 16%, 반대 73%, EU의 미국 군사적 지원에는 찬성 19%, 반대 70%, 그리고 자국 내 테러 위험이 증가할 것이라는 데 54%가 동의, 27%는 비동의했다.
───
이번 전쟁에서 지지하는 진영
───
신체적, 재정적, 정서적 측면 개인 피해
───
예상 승전국
───
전쟁 발발 책임 소재
───
이란 최고 지도자 암살
───
자국 정부 전쟁 대응 평가
───
주요 9개국 전쟁 대응 평가
───
이란 정부 교체 성패
───
전후 이란/중동/이스라엘 상황
───
전쟁 지속 기간
───
(EU 일부 한정) 미국 군사적 지원, 자국 내 테러 가능성
──────────────────
Iran Conflict: Public Opinion Leaves U.S. Isolated
— Blamed for War, Little Faith in Outcomes, and Widespread Economic Concern
──────────────────
Publics Fear Economic Fallout (85%) and See No Quick End (59%)
— While 80% Blame USA/Israel, Most Refuse to Take Sides (60%)
The Gallup International Association has released findings from a new multi-country snap poll on the ongoing war involving the USA, Israel and Iran, revealing a striking global pattern: among those aware of the conflict, most people are unwilling to take sides, believe the war will lead to instability, doubt that regime change will succeed, expect a prolonged conflict, and widely see the USA and Israel as responsible for initiating the war.
The survey was conducted across 15 countries with a total sample of approximately 13,000 respondents.
This is the first multi-country snapshots of public opinion on the Iran conflict, captured in real time through a coordinated effort by professional pollsters. Gallup International Association has a legacy of conducting similar multi-country surveys at rapid pace to inform policy makers on what publics around the world are thinking as conflicts unfold.
Most Refuse to Take Sides (60%)
Across countries, the dominant public response is not support for either side, but distance. A clear majority, 60% say they support neither side, compared to 16% who support the USA–Israel coalition and 16% who support Iran.
Support for Iran is highest in Pakistan at 79%, followed by Türkiye at 36%. Support for USA-Israel alliance is highest in Colombia at 30%, followed by Philippines (28%).
Many Blame the USA and Israel for starting the war (44% Equal Responsibility; 80% Combined Attribution)
On the question of responsibility, the most common global view is that the USA and Israel are equally responsible, cited by 44% of respondents. 24% blame the USA alone,12% blame Israel alone, while15% blame Iran. Taken together, 80% attribute responsibility at least partly to the USA and Israel.
Regime Change Widely Seen as Unlikely (47% Fail vs 21% Succeed)
Publics are skeptical that war will achieve one of its key potential objectives. 47% believe efforts to replace Iran’s government will fail, 21% believe they will succeed, 32% remain uncertain.
World Expects Turmoil (63% Iran Chaos; 60% Regional Instability; 69% Continued Threats to Israel)
Across outcomes, the global public expects instability. 63% expect chaos and internal strife in Iran, 60% believe the Middle East will become more unstable, 69% think Israel will continue to face external attacks.
A Long War is Expected (59% Say Many Months vs 26% Weeks)
59% expect the war to last many months, 26% expect it to end within weeks.
Economic Impact is Nearly Universal
53% expect strong financial harm, 33% expect minor financial harm, while only 9% expect no harm. Detailed findings can be found on Gallup International website.
Commentary from Gallup International Association team which led this first multi-country poll on Iran Conflict: This multi-country survey shows large majorities believe the United States and Israel have initiated a war that is unlikely to end soon, is not expected to lead to regime change, and is seen as causing significant economic harm without delivering greater security for Israel or stability in the Middle East. Across countries, including traditional allies, publics increasingly see the United States as standing alone in its narrative on the conflict. While they may not align with Iran, they are clearly not aligning with the U.S. either.
Methodology
The study was conducted by the Gallup International Association with a total sample of approximately 13,000 respondents across 15 countries. The survey covers a diverse set of countries, with an average sample of around 850 respondents per country. The findings are based on adults who reported being aware of the war. Data were collected using nationally representative approaches, employing a mix of online and telephone interviews depending on country context. In some countries, non-probability online panels were used; further details on these approaches are provided in the full methodology note. Data were weighted to reflect national population characteristics, and global results are computed as averages across countries. Fieldwork for the study was conducted between 5th March and 30th March 2026.
Note: Across the 15 countries covered in this study, nationally representative samples were achieved in 14 countries, while 1 country had more limited or non-national coverage due to methodological constraints in terms of sampling design.
Out of 15 countries, 8 used probability-based sampling, 5 used quota sampling, and 2 relied on non-probability samples. Here is list of countries with relevant methods used: Random Probability (8 countries): Croatia, Germany, Pakistan, Serbia, Slovenia, Sweden, Switzerland, and Türkiye; Quota Sampling (5 countries): Colombia, Japan, Portugal, Republic of Korea, and Spain; Non-Probability Sample (2 countries): Mexico and Philippines.
Given the use of non-probability sampling, a conventional margin of error is not reported, as it is not strictly applicable in such designs. Accordingly, the findings should be interpreted with appropriate caution and viewed as indicative of public sentiment rather than precise population estimates, particularly when making cross-country comparisons.
───
한국 응답자 특성표