- 외국에서 오는 이민(移民), 국내 거주 이민족(異民族) 관련 인식 - Gallup International 다국가 조사
- 조사일 : 2025/02/14
- [GallupReport(20250731)_Immigration_GIA.pdf] 다운로드
● 2025년 7월 31일(목) 공개 | 문의: 02-3702-2571/2621/2622
외국인 이민(移民), 자국 거주 이민족(異民族) 관련 인식:
Gallup International 다국가 조사
→ 한국+세계 조사 결과 파일 다운로드(PDF)
/ 세계 조사 개요
· 2024년 10월~2025년 2월 45개국 성인 총 46,195명 전화/온라인/면접조사(주제별 참여국 상이)
/ 한국 조사 개요
· 조사기간: 2024년 11월 11~25일
· 표본추출: 층화 집락 확률 비례 추출
· 응답방식: 면접조사원 인터뷰(CAPI)
· 조사대상: 전국(제주 제외) 만 19세 이상 1,534명
· 표본오차: ±2.5%포인트(95% 신뢰수준)
· 응답률: 28.8%(총 접촉 5,326명 중 1,534명 응답 완료)
· 의뢰처: 한국갤럽-Gallup International 자체 조사
/ 조사 문항(아래 순서대로 질문)
→ 외국인 이민은 자국에 좋은 일인가, 나쁜 일인가?
→ 자국 거주 이민족보다 나와 같은 민족을 더 신뢰하는가?
→ (영문) Gallup International commentary
→ 한국 응답자 특성표
요약
[외국인 이민] 43개국 시민 30% '자국에 좋은 일'... '나쁜 일' 35%, 중립 31%
· '좋은 일' 상위국: 필리핀 66%, 파키스탄 57%, 사우디아라비아 52%, 노르웨이 50%...
· '나쁜 일' 상위국: 이라크 76%, 페루 64%, 인도 58%, 조지아 51%, 멕시코 49%...
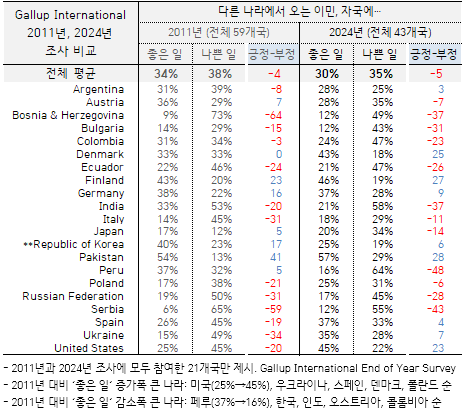
· 2011년 대비 ‘좋은 일‘ 증가폭 큰 나라: 미국(25%→45%), 우크라이나, 스페인, 덴마크, 폴란드 순
· 2011년 대비 ‘좋은 일‘ 감소폭 큰 나라: 페루(37%→16%), 한국, 인도, 오스트리아, 콜롬비아 순
[한국] 국내 이민 '좋은 일' 2011년 40% → 2024년 25%, '나쁜 일' 23%→19%, 중립 34%→54%
· 13년 전 대비 전 연령대 긍정론 감소, 특히 20대 낙폭 큰 편(57%→31%)
[민족 신뢰] 42개국 시민 54% '자국 거주 이민족보다 나와 같은 민족 더 신뢰한다', '그렇지 않다' 36%
· '자민족 더 신뢰' 상위국: 중국 86%, 조지아 82%, 한국 73%, 파키스탄 72%, 불가리아 69%...
· 보스니아헤르체고비나, 미국, 독일 등 다민족 구성·이민자 수용 많은 나라 동의율 낮은 편
조사 결과
────────────
다른 나라에서 오는 이민(移民)
────────────
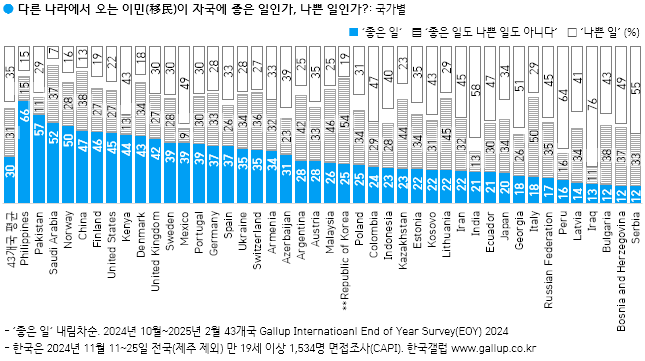
43개국 시민 30% '자국에 좋은일'... '나쁜 일' 35%, 중립 31%
- '좋은 일' 상위국: 필리핀 66%, 파키스탄 57%, 사우디아라비아 52%, 노르웨이 50%...
- '나쁜 일' 상위국: 이라크 76%, 페루 64%, 인도 58%, 조지아 51%, 멕시코 49%...
2024년 10월부터 2025년 2월까지 갤럽 인터내셔널이 43개국 성인 44,276명에게 외국인 이주 근로자를 포함해 다른 나라에서 오는 이민이 자국에 좋은 일이라고 생각하는지, 나쁜 일이라고 생각하는지 물었다. 그 결과 30%는 자국에 '좋은 일', 35%는 '나쁜 일', 31%는 어느 쪽도 아니라고(이하 '중립') 답했다. 4%는 의견을 유보했다.
◎ 자국으로의 이민 긍정론 상위 5개국은 필리핀(66%), 파키스탄(57%), 사우디아라비아(52%), 노르웨이(50%), 중국(47%), 부정론 상위 5개국은 이라크(76%), 페루(64%), 인도(58%), 조지아(51%), 멕시코(49%)다.
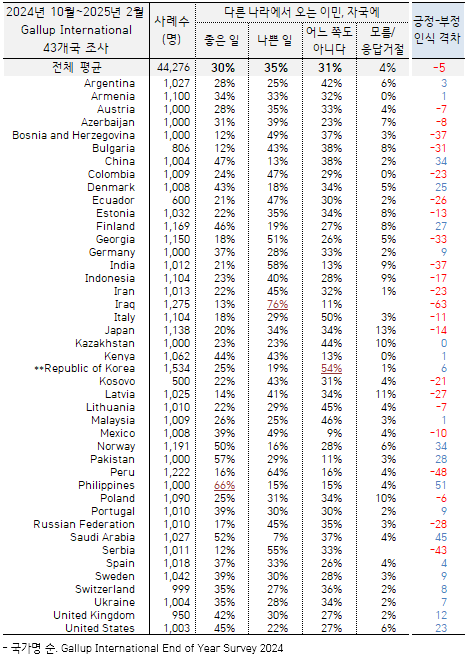
◎ 이번 조사에 참여한 43개국 중 21개국은 2011년에도 같은 질문을 했다. 자국 이민 긍정론을 13년 전과 비교하면 미국(25%→45%)과 우크라이나(15%→35%), 스페인(26%→37%) 등에서 증가, 페루(37%→16%), 한국(40%→25%), 인도(33%→21%) 등에서는 감소했다.
─
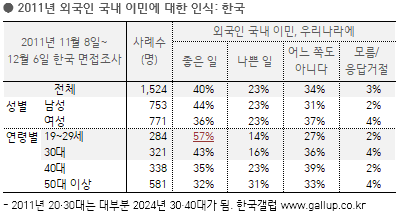
한국인, 국내 이민 '좋은 일' 2011년 40% → 2024년 25%
- '나쁜 일' 23%→19%, '어느 쪽도 아니다' 34%→54%
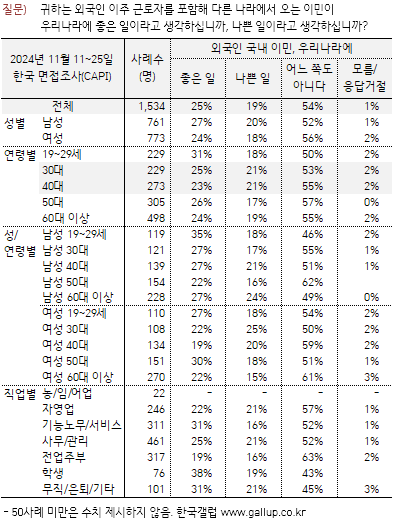
한국 조사는 2024년 11월 11~25일 전국(제주 제외) 만 19세 이상 1,534명을 대상으로 했다. 한국인 중에서는 25%가 국내로의 이민을 '좋은 일', 19%가 '나쁜 일'로 봤고, 절반가량(54%)은 좋거나 나쁘게 생각지 않았다. 성별, 연령별로도 이와 유사한 경향을 보였다.
◎ 2011년(19세 이상 1,524명) 동일 질문에는 한국인의 40%가 국내 이민을 '좋은 일'로 봤고, 23%가 '나쁜 일', 34%는 어느 쪽도 아니라고 답했다. 13년 전과 비교하면 전 연령대에 걸쳐 긍정론이 감소했고, 특히 20대에서의 낙폭(57%→31%)이 두드러졌다.
◎ 참고로, 법무부에 따르면 국내 체류 외국인은 2011년 말 기준 139.5만 명에서 2024년 265.1만 명으로 크게 늘었다(→ 지표누리, 2025년 6월 273.3만 명). 체류자격별(2023년)로 보면 재외동포(F-4) 53.6만, 비전문취업(E-9) 31.1만, 사증면제(B-1) 22.4만, 영주(F-5) 18.5만, 단기방문(C-3) 17.6만, 유학(D-2) 15.2만, 결혼이민(F-6) 14.2만, 관광통과(B-2) 13.7만, 방문동거(F-1) 11.2만 명 등이다(→ KOSIS). 2024년 말 우리나라 주민등록 총 인구수는 5,121.7만 명(외국인 제외, 거주자·거주불명자·재외국민 포함 → 행정안전부)이다.
────────────
'자국 거주 이민족(異民族)보다 나와 같은 민족 더 신뢰한다'
────────────
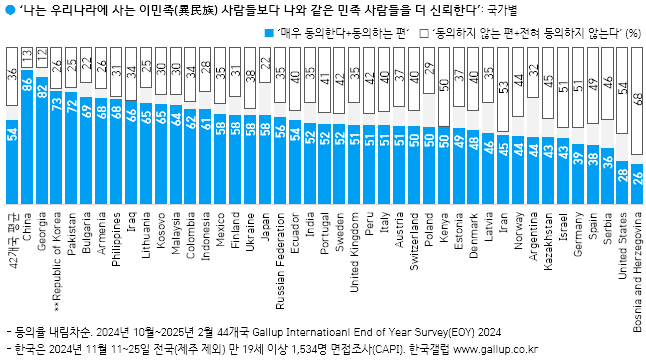
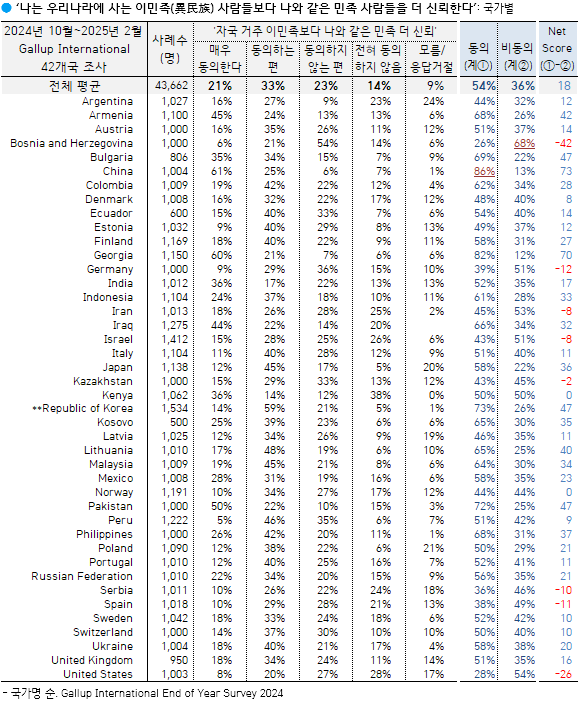
42개국 시민 중 54% 동의, 36% 비동의
- '자민족 더 신뢰' 상위국: 중국 86%, 조지아 82%, 한국 73%, 파키스탄 72%, 불가리아 69%...
- 보스니아헤르체고비나, 미국, 독일 등 민족 다양성·이민자 유입 많은 나라 동의율 낮은 편
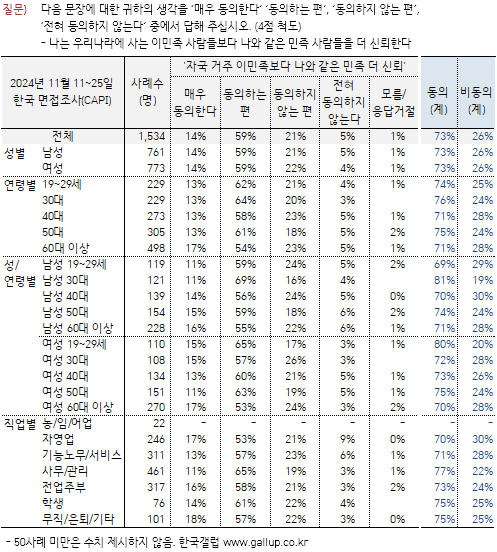
다음으로 42개국 시민에게 '자국 거주 이민족 사람들보다 자신과 같은 민족 사람들을 더 신뢰한다'라는 문장에 대한 동의 여부를 물었다(4점 척도). 그 결과 54%가 동의했고, 36%는 동의하지 않았다('매우 동의' 21%, '동의하는 편' 33%, '동의하지 않는 편' 23%, '전혀 동의하지 않는다' 14%). 9%는 의견을 유보했다.
◎ 동의율 높은 나라는 중국(86%), 조지아(82%), 한국(73%), 파키스탄(72%), 불가리아(69%) 순이며, 독일(39%), 스페인(38%), 세르비아(36%), 미국(28%), 보스니아헤르체고비나(26%) 등에서는 그 비율이 40%를 넘지 않았다. 이는 민족적·인종적·사회문화적 다양성, 이민자 포용성 등과 연관지어 볼 수 있겠다.
◎ 이 문항만 보면 한국이 다른 나라보다 자민족을 우선시하는 것처럼 보일 수도 있다. 그러나 한국의 '매우 동의' 비율(14%)은 중국(61%), 조지아(60%), 파키스탄(50%)에 비해 현저히 낮은 편이며, 다른 일면을 보여주는 조사 결과도 있다. 지난 2022년 전국 19~59세 1,202명 조사에서 '한국은 단일민족 국가'라는 주장에 찬반이 45%:48%로 팽팽하게 갈렸고, '인구 감소 해결을 위해서는 외국인 이민 확대가 필요하다'는 데 94%가 동의했으며, 열에 여섯은 외국인 이민자가 경제적·사회문화적으로 기여한다고 봤다(→ G20230511).
──────────────────
More people view immigration negatively
than those who view it positively
──────────────────
Over the course of the last decade and half there has been a fall in the number of people globally who feel that immigration is a good thing. In 2011, one in three (34%) could see the positives of immigration; now in 2025 this number has fallen to 30%. Indeed today, there are more people who think the effects are bad (35%) than good (30%).
Our Gallup International poll interviewed more than 44,000 adults throughout 43 countries around the world.
Those surveyed in the Philippines and Saudi Arabia were most positive towards immigration while those in Iraq, Peru and Serbia were most negative towards it. Regionally those in South Asia, Latin America and Eastern Europe were most negative. Between 2011 and 2024 , Peru , South Korea and India saw greatest decline in positive feeling about immigration.
But what impact might this be having on tolerance and in this case, specifically ethnic tolerance. Our survey asked people whether they “In general, can trust people from their ethnic group more than they can trust people from other ethnic groups in their country” The change seen here over twenty years is less profound; in 2004 56% of those surveyed agreed with the statement, while in 2024 it was 54% (although we are less sure than we were as the number strongly agreeing with the statement fell from 28% to 21% over these two decades).
Evidence of an increasingly divided society in America helps to explain perhaps why they remain one of the least trusting of people from other ethnic groups – 56% say they cant trust them, against 28% who say they can. And more broadly, trust among those in higher income countries is significantly lower than trust among those living in lower and middle income countries.
Michael Nitsche, President of Gallup International comments:
“Immigration has been a hot topic over the last two decades and had significant media attention. Conflicts in the Middle East, Africa and Asia have caused many to emigrate in search of a better life. However, our survey reveals more people view immigration negatively than positively across the world. Countries such as the United States, Saudi Arabia and Germany host significant numbers of immigrants, many contributing to their economies. Yet in all these three countries more people view immigration positively than negatively.”
───
한국 응답자 특성표
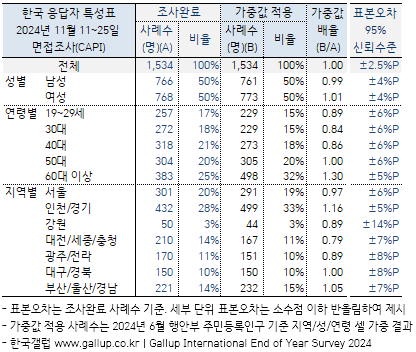
| ● 데일리 오피니언은 작년부터 조사 빈도를 조금 줄였습니다. 매주 화~목 중 공휴일이 포함되어 조사 기간 사흘이 확보되지 않을 때는 조사를 쉬고, 명절과 연말연시에 이어 여름 휴가철 휴지기를 도입했습니다. 조사의 질적 제고와 시민의 참여 편의를 고려한 방편이니 부디 너른 양해 바랍니다. 올여름은 3주간(7/21~8/8) 데일리 조사를 쉽니다. 그동안 미공개 결과를 전하며, 8월 15일(금)에 제630호를 공개합니다. → 데일리 조사 & 한국갤럽 연간 휴무 일정 ● 1947년 조지 갤럽 박사가 설립한 갤럽 인터내셔널(Gallup International Association)은 1977년부터 전 세계 회원사들이 매년 말 자국민 대상으로 경제, 노동, 국제 관계 등 현안에 대한 인식과 새해 전망을 알아보는 〈End of Year Survey〉를 해왔습니다. 한국갤럽은 1979년부터 참여하고 있습니다. → Press release for the 120th Anniversary of Dr. George Gallup |
외국인 이민(移民), 자국 거주 이민족(異民族) 관련 인식:
Gallup International 다국가 조사
→ 한국+세계 조사 결과 파일 다운로드(PDF)
/ 세계 조사 개요
· 2024년 10월~2025년 2월 45개국 성인 총 46,195명 전화/온라인/면접조사(주제별 참여국 상이)
/ 한국 조사 개요
· 조사기간: 2024년 11월 11~25일
· 표본추출: 층화 집락 확률 비례 추출
· 응답방식: 면접조사원 인터뷰(CAPI)
· 조사대상: 전국(제주 제외) 만 19세 이상 1,534명
· 표본오차: ±2.5%포인트(95% 신뢰수준)
· 응답률: 28.8%(총 접촉 5,326명 중 1,534명 응답 완료)
· 의뢰처: 한국갤럽-Gallup International 자체 조사
/ 조사 문항(아래 순서대로 질문)
→ 외국인 이민은 자국에 좋은 일인가, 나쁜 일인가?
→ 자국 거주 이민족보다 나와 같은 민족을 더 신뢰하는가?
→ (영문) Gallup International commentary
→ 한국 응답자 특성표
요약
[외국인 이민] 43개국 시민 30% '자국에 좋은 일'... '나쁜 일' 35%, 중립 31%
· '좋은 일' 상위국: 필리핀 66%, 파키스탄 57%, 사우디아라비아 52%, 노르웨이 50%...
· '나쁜 일' 상위국: 이라크 76%, 페루 64%, 인도 58%, 조지아 51%, 멕시코 49%...
· 2011년 대비 ‘좋은 일‘ 증가폭 큰 나라: 미국(25%→45%), 우크라이나, 스페인, 덴마크, 폴란드 순
· 2011년 대비 ‘좋은 일‘ 감소폭 큰 나라: 페루(37%→16%), 한국, 인도, 오스트리아, 콜롬비아 순
[한국] 국내 이민 '좋은 일' 2011년 40% → 2024년 25%, '나쁜 일' 23%→19%, 중립 34%→54%
· 13년 전 대비 전 연령대 긍정론 감소, 특히 20대 낙폭 큰 편(57%→31%)
[민족 신뢰] 42개국 시민 54% '자국 거주 이민족보다 나와 같은 민족 더 신뢰한다', '그렇지 않다' 36%
· '자민족 더 신뢰' 상위국: 중국 86%, 조지아 82%, 한국 73%, 파키스탄 72%, 불가리아 69%...
· 보스니아헤르체고비나, 미국, 독일 등 다민족 구성·이민자 수용 많은 나라 동의율 낮은 편
조사 결과
────────────
다른 나라에서 오는 이민(移民)
────────────
43개국 시민 30% '자국에 좋은일'... '나쁜 일' 35%, 중립 31%
- '좋은 일' 상위국: 필리핀 66%, 파키스탄 57%, 사우디아라비아 52%, 노르웨이 50%...
- '나쁜 일' 상위국: 이라크 76%, 페루 64%, 인도 58%, 조지아 51%, 멕시코 49%...
2024년 10월부터 2025년 2월까지 갤럽 인터내셔널이 43개국 성인 44,276명에게 외국인 이주 근로자를 포함해 다른 나라에서 오는 이민이 자국에 좋은 일이라고 생각하는지, 나쁜 일이라고 생각하는지 물었다. 그 결과 30%는 자국에 '좋은 일', 35%는 '나쁜 일', 31%는 어느 쪽도 아니라고(이하 '중립') 답했다. 4%는 의견을 유보했다.
◎ 자국으로의 이민 긍정론 상위 5개국은 필리핀(66%), 파키스탄(57%), 사우디아라비아(52%), 노르웨이(50%), 중국(47%), 부정론 상위 5개국은 이라크(76%), 페루(64%), 인도(58%), 조지아(51%), 멕시코(49%)다.
◎ 이번 조사에 참여한 43개국 중 21개국은 2011년에도 같은 질문을 했다. 자국 이민 긍정론을 13년 전과 비교하면 미국(25%→45%)과 우크라이나(15%→35%), 스페인(26%→37%) 등에서 증가, 페루(37%→16%), 한국(40%→25%), 인도(33%→21%) 등에서는 감소했다.
─
한국인, 국내 이민 '좋은 일' 2011년 40% → 2024년 25%
- '나쁜 일' 23%→19%, '어느 쪽도 아니다' 34%→54%
한국 조사는 2024년 11월 11~25일 전국(제주 제외) 만 19세 이상 1,534명을 대상으로 했다. 한국인 중에서는 25%가 국내로의 이민을 '좋은 일', 19%가 '나쁜 일'로 봤고, 절반가량(54%)은 좋거나 나쁘게 생각지 않았다. 성별, 연령별로도 이와 유사한 경향을 보였다.
◎ 2011년(19세 이상 1,524명) 동일 질문에는 한국인의 40%가 국내 이민을 '좋은 일'로 봤고, 23%가 '나쁜 일', 34%는 어느 쪽도 아니라고 답했다. 13년 전과 비교하면 전 연령대에 걸쳐 긍정론이 감소했고, 특히 20대에서의 낙폭(57%→31%)이 두드러졌다.
◎ 참고로, 법무부에 따르면 국내 체류 외국인은 2011년 말 기준 139.5만 명에서 2024년 265.1만 명으로 크게 늘었다(→ 지표누리, 2025년 6월 273.3만 명). 체류자격별(2023년)로 보면 재외동포(F-4) 53.6만, 비전문취업(E-9) 31.1만, 사증면제(B-1) 22.4만, 영주(F-5) 18.5만, 단기방문(C-3) 17.6만, 유학(D-2) 15.2만, 결혼이민(F-6) 14.2만, 관광통과(B-2) 13.7만, 방문동거(F-1) 11.2만 명 등이다(→ KOSIS). 2024년 말 우리나라 주민등록 총 인구수는 5,121.7만 명(외국인 제외, 거주자·거주불명자·재외국민 포함 → 행정안전부)이다.
────────────
'자국 거주 이민족(異民族)보다 나와 같은 민족 더 신뢰한다'
────────────
42개국 시민 중 54% 동의, 36% 비동의
- '자민족 더 신뢰' 상위국: 중국 86%, 조지아 82%, 한국 73%, 파키스탄 72%, 불가리아 69%...
- 보스니아헤르체고비나, 미국, 독일 등 민족 다양성·이민자 유입 많은 나라 동의율 낮은 편
다음으로 42개국 시민에게 '자국 거주 이민족 사람들보다 자신과 같은 민족 사람들을 더 신뢰한다'라는 문장에 대한 동의 여부를 물었다(4점 척도). 그 결과 54%가 동의했고, 36%는 동의하지 않았다('매우 동의' 21%, '동의하는 편' 33%, '동의하지 않는 편' 23%, '전혀 동의하지 않는다' 14%). 9%는 의견을 유보했다.
◎ 동의율 높은 나라는 중국(86%), 조지아(82%), 한국(73%), 파키스탄(72%), 불가리아(69%) 순이며, 독일(39%), 스페인(38%), 세르비아(36%), 미국(28%), 보스니아헤르체고비나(26%) 등에서는 그 비율이 40%를 넘지 않았다. 이는 민족적·인종적·사회문화적 다양성, 이민자 포용성 등과 연관지어 볼 수 있겠다.
◎ 이 문항만 보면 한국이 다른 나라보다 자민족을 우선시하는 것처럼 보일 수도 있다. 그러나 한국의 '매우 동의' 비율(14%)은 중국(61%), 조지아(60%), 파키스탄(50%)에 비해 현저히 낮은 편이며, 다른 일면을 보여주는 조사 결과도 있다. 지난 2022년 전국 19~59세 1,202명 조사에서 '한국은 단일민족 국가'라는 주장에 찬반이 45%:48%로 팽팽하게 갈렸고, '인구 감소 해결을 위해서는 외국인 이민 확대가 필요하다'는 데 94%가 동의했으며, 열에 여섯은 외국인 이민자가 경제적·사회문화적으로 기여한다고 봤다(→ G20230511).
──────────────────
More people view immigration negatively
than those who view it positively
──────────────────
Over the course of the last decade and half there has been a fall in the number of people globally who feel that immigration is a good thing. In 2011, one in three (34%) could see the positives of immigration; now in 2025 this number has fallen to 30%. Indeed today, there are more people who think the effects are bad (35%) than good (30%).
Our Gallup International poll interviewed more than 44,000 adults throughout 43 countries around the world.
Those surveyed in the Philippines and Saudi Arabia were most positive towards immigration while those in Iraq, Peru and Serbia were most negative towards it. Regionally those in South Asia, Latin America and Eastern Europe were most negative. Between 2011 and 2024 , Peru , South Korea and India saw greatest decline in positive feeling about immigration.
But what impact might this be having on tolerance and in this case, specifically ethnic tolerance. Our survey asked people whether they “In general, can trust people from their ethnic group more than they can trust people from other ethnic groups in their country” The change seen here over twenty years is less profound; in 2004 56% of those surveyed agreed with the statement, while in 2024 it was 54% (although we are less sure than we were as the number strongly agreeing with the statement fell from 28% to 21% over these two decades).
Evidence of an increasingly divided society in America helps to explain perhaps why they remain one of the least trusting of people from other ethnic groups – 56% say they cant trust them, against 28% who say they can. And more broadly, trust among those in higher income countries is significantly lower than trust among those living in lower and middle income countries.
Michael Nitsche, President of Gallup International comments:
“Immigration has been a hot topic over the last two decades and had significant media attention. Conflicts in the Middle East, Africa and Asia have caused many to emigrate in search of a better life. However, our survey reveals more people view immigration negatively than positively across the world. Countries such as the United States, Saudi Arabia and Germany host significant numbers of immigrants, many contributing to their economies. Yet in all these three countries more people view immigration positively than negatively.”
───
한국 응답자 특성표