- 선호 자녀 성별 - Gallup Internationl 다국가 조사 #아들 #딸
- 조사일 : 2025/02/14
- [GallupReport(20250724)_Child_GIA.pdf] 다운로드
● 2025년 7월 24일(목) 공개 | 문의: 02-3702-2571/2621/2622
아이를 한 명만 가질 수 있다면 어떤 성별을 원하십니까?:
Gallup International 다국가 조사
→ 한국+세계 조사 결과 파일 다운로드(PDF)
/ 세계 조사 개요
· 2024년 10월~2025년 2월 44개국 성인 총 44,783명 전화/온라인/면접조사(주제별 참여국 상이)
/ 한국 조사 개요
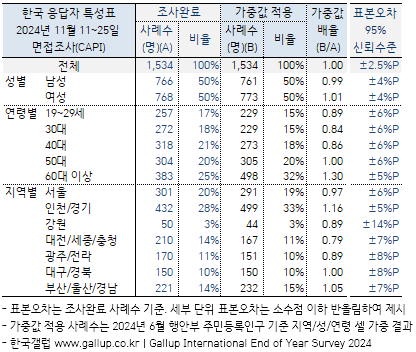
· 조사기간: 2024년 11월 11~25일
· 표본추출: 층화 집락 확률 비례 추출
· 응답방식: 면접조사원 인터뷰(CAPI)
· 조사대상: 전국(제주 제외) 만 19세 이상 1,534명
· 표본오차: ±2.5%포인트(95% 신뢰수준)
· 응답률: 28.8%(총 접촉 5,326명 중 1,534명 응답 완료)
· 의뢰처: 한국갤럽-Gallup International 자체 조사
요약
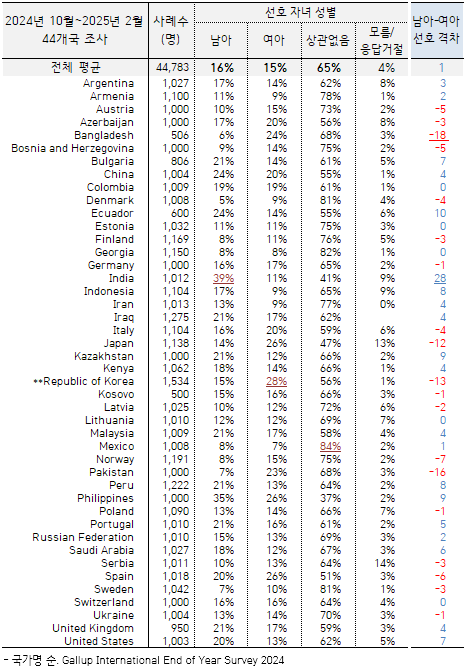
[44개국] 성인 중 65% '특별히 원하는 자녀 성별 없다'... '남아' 선호 16%, '여아' 15%
· 남아 선호 상위국: 인도 39%, 필리핀 35%, 에콰도르·중국 24%, 영국 21%...
· 여아 선호 상위국: 한국 28%, 일본·스페인·필리핀 26%, 방글라데시 24%...
· 선호 격차 큰 나라: 인도(남아 우위), 방글라데시, 파키스탄, 한국, 일본(이상 여아)
[한국] '남아' 15%, '여아' 28%, '상관없음' 56%
· 한국인의 남아 선호 1992년 58%에서 2024년 15%로 감소
· 전 연령대 성별 무관 견해 우세, 60대 이상에서만 남·여아 선호 비슷
· 50대 이하는 여아 더 원해, 특히 30·40대 여성은 절반 육박
조사 결과
────────────
아이를 한 명만 가질 수 있다면 어떤 성별을 원하십니까?
────────────
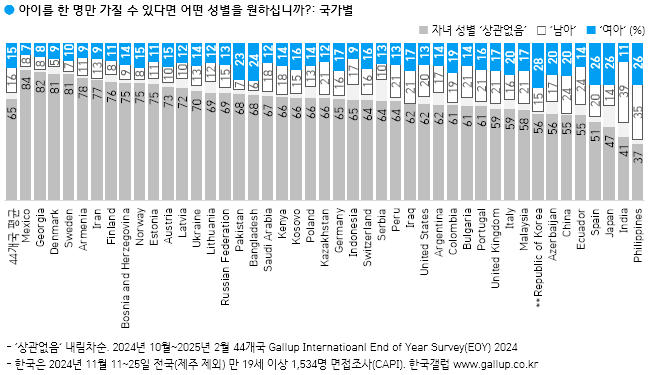
44개국 시민 65% '상관없음'... '남아' 16%, '여아' 15%
- 남아 선호 상위국: 인도 39%, 필리핀 35%, 에콰도르·중국 24%, 영국 21%...
- 여아 선호 상위국: 한국 28%, 일본·스페인·필리핀 26%, 방글라데시 24%...
2024년 10월부터 2025년 2월까지 갤럽 인터내셔널이 44개국 성인 44,783명에게 아이를 한 명만 가질 수 있다면 어떤 성별을 원하는지 물었다. 그 결과 65%는 성별 상관없다고 답했고, 16%는 남아, 15%는 여아를 원했다. 4%는 의견을 유보했다.
◎ 대부분 국가에서 특별히 원하는 자녀 성별 없다는 견해가 우세하며, 멕시코(84%), 조지아(82%), 덴마크·스웨덴(81%)에서는 그 비율이 80%를 넘었다. 남아 선호 상위 5개국은 인도(39%), 필리핀(35%), 에콰도르·중국(24%), 영국(21%), 여아 선호 상위 5개국은 한국(28%), 일본·스페인·필리핀(26%), 방글라데시(24%)다.
◎ 44개국 중 5개 나라에서는 남·여아 선호 격차가 10%포인트를 넘었다. 인도는 남아(39%: 여아 11%) 선호가 28%포인트 앞섰고, 방글라데시(6%:24%), 파키스탄(7%:23%), 한국(15%:28%), 일본(14%:26%)은 여아 선호가 12~18%포인트 많았다.
─
한국인의 남아 선호 1992년 58%에서 2024년 15%로 감소
한국 조사는 2024년 11월 11~25일 전국(제주 제외) 만 19세 이상 1,534명을 대상으로 했다. 한국인은 전 연령대에서 자녀 성별 무관 견해가 우세한 가운데, 60대 이상에서만 남·여아(23%·20%) 선호가 비슷하고 50대 이하는 여아를 더 원했다. 성·연령별로 보면 특히 30·40대 여성의 여아 선호(40%대) 경향이 두드러졌다.
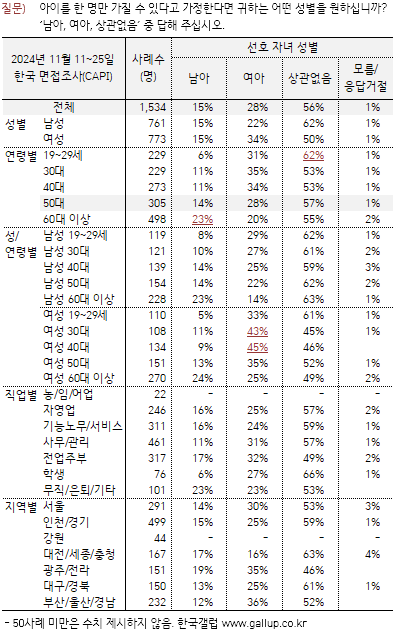
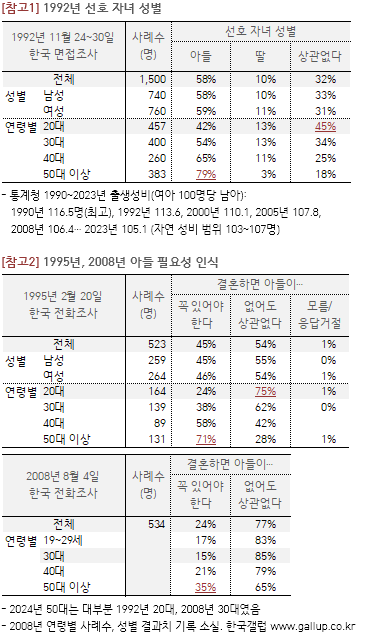
◎ 1992년(20세 이상 1,500명) 동일 질문에는 한국인의 58%가 아들, 10%가 딸을 택했고 32%가 성별 상관없다고 답했다. 당시 연령별 아들 선호 비율은 20대 42%, 30대 54%, 40대 65%, 50대 이상 79%였다. 30여 년 전 20대는 2024년 대부분 50대가 되었고, 그들의 선호 자녀 성별은 남아 14%, 여아 28%, 무관 57%로 바뀌었다.
참고로, '결혼하면 아들이 꼭 있어야 한다'는 의견은 1995년(20세 이상 523명) 45%에서 2008년(19세 이상 534명) 24%로 줄었다(→ G20080901).
◎ 1990~2023년 우리나라 출생성비(여아 100명당 남아)는 1990년 116.5명(최고), 1992년 113.6명, 2000년 110.1명, 2005년 107.8명, 2008년 106.4명, 2023년 105.1명이다(→ 통계청). 2000년까지 110명을 웃돌다가 2008년 이후로는 자연 성비 범위(103~107명)에 든다.
──────────────────
Majority Worldwide Say Child’s Gender Does Not Matter—
Yet Regional and Social Divides Persist
──────────────────
A global end-of-year survey conducted across 44 countries with nearly 45,000 respondents reveals that attitudes toward gender preference in children are shifting toward greater neutrality. When asked: "Suppose you could have only one child. Would you prefer that it be a boy or a girl, or is gender irrelevant?", the majority globally (65%) indicated that gender is irrelevant. However, deeper analysis shows that this neutrality is not evenly distributed.
The global survey was conducted in between October 2024 and February 2025 among 44,783 scientifically selected men and women, on average a sample of 1000 in each polled nation.
KEY FINDINGS
The key findings from the survey data are the following:
1. Country-wise differences:
Country-wise breakdown reveals stark contrasts in gender preference across countries. The top five nations with the highest preference for a boy child are India (39%), Philippines (35%), Ecuador (24%), China (24%), and United Kingdom (21%). On the other hand, the highest preference for a girl child was recorded in Republic of Korea (28%), Japan (26%), Spain (26%), Philippines (26%) and Bangladesh (23%). Meanwhile, gender neutrality was most strongly expressed in Mexico (84%), Georgia (82%), Denmark (81%), Sweden (81%), and Armenia (78%).
2. Gender differences:
The survey found distinct differences between men and women. Men were more likely to prefer having a boy (20%) compared to women (12%). Conversely, 19% of women expressed a preference for having a girl, while only 12% of men said the same. Despite these variations, a majority in both groups—66% of women and 64% of men—indicated that the gender of the child is irrelevant, showing that gender neutrality is now the dominant view across genders.
3. Education differences:
Education was a strong predictor of gender-neutral views. Respondents with low education had the highest preference for boys (17%). In contrast, those with higher education were significantly more likely to say that gender does not matter (65%).
4. National income differences:
National income levels also influenced preferences. In low-income countries, 19% of respondents still preferred a boy, and only 61% said gender is irrelevant. In contrast, middle-income countries reported 16% boy preference, with 66% indicating gender neutrality. High-income countries showed the lowest boy preference (14%) and indifference to child gender (66%), indicating that economic development correlates with more egalitarian views.
5. Regional differences:
Regional differences were particularly striking. Preference for boys was highest in Southeast Asia (24%), followed by the Arab World (20%), and North America (20%). Western and Eastern Europe reported the lowest boy preferences at 13% and 12% respectively. When it came to preference for girls, Northeast Asia led with 25%, followed by South Asia at 18%. Western Europe also stood out, with 16% of respondents expressing a preference for a girl. Gender-neutral responses were most common in Eastern Europe (71%), followed by Western Europe (68%), Latin America, Africa and West Asia (66% each), and the Arab World (64%) and North America (62%). In contrast, gender neutrality was lowest in Northeast Asia (53%) and Southeast Asia (54%).
These findings suggest that while the world is moving towards greater gender equality in family preferences, deep-rooted cultural and socio-economic factors continue to shape individual attitudes. Traditional preferences—particularly for boys—remain strong in some regions, especially where educational and economic indicators are lower.
Commentary on poll findings by
Michael Nitsche, President Gallup International Association in Vienna, Johny Heald, Board Member GIA in London and Bilal Gilani, Board Member GIA in Islamabad:
“The survey highlights both encouraging signs of progress and enduring cultural norms. While a majority globally embrace gender neutrality, targeted efforts are still needed to address persistent biases—especially in regions and demographic groups where boy preference remains high.”
───
한국 응답자 특성표
| ● 데일리 오피니언은 작년부터 조사 빈도를 조금 줄였습니다. 매주 화~목 중 공휴일이 포함되어 조사 기간 사흘이 확보되지 않을 때는 조사를 쉬고, 명절과 연말연시에 이어 여름 휴가철 휴지기를 도입했습니다. 조사의 질적 제고와 시민의 참여 편의를 고려한 방편이니 부디 너른 양해 바랍니다. 올여름은 3주간(7/21~8/8) 데일리 조사를 쉽니다. 그동안 미공개 결과를 전하며, 8월 15일(금)에 제630호를 공개합니다. → 데일리 조사 & 한국갤럽 연간 휴무 일정 ● 1947년 조지 갤럽 박사가 설립한 갤럽 인터내셔널(Gallup International Association)은 1977년부터 전 세계 회원사들이 매년 말 자국민을 대상으로 경제, 노동, 국제 관계 등 현안에 대한 인식과 새해 전망을 알아보는 〈End of Year Survey〉를 해왔습니다. 한국갤럽은 1979년부터 참여하고 있습니다. → Press release for the 120th Anniversary of Dr. George Gallup |
아이를 한 명만 가질 수 있다면 어떤 성별을 원하십니까?:
Gallup International 다국가 조사
→ 한국+세계 조사 결과 파일 다운로드(PDF)
/ 세계 조사 개요
· 2024년 10월~2025년 2월 44개국 성인 총 44,783명 전화/온라인/면접조사(주제별 참여국 상이)
/ 한국 조사 개요
· 조사기간: 2024년 11월 11~25일
· 표본추출: 층화 집락 확률 비례 추출
· 응답방식: 면접조사원 인터뷰(CAPI)
· 조사대상: 전국(제주 제외) 만 19세 이상 1,534명
· 표본오차: ±2.5%포인트(95% 신뢰수준)
· 응답률: 28.8%(총 접촉 5,326명 중 1,534명 응답 완료)
· 의뢰처: 한국갤럽-Gallup International 자체 조사
요약
[44개국] 성인 중 65% '특별히 원하는 자녀 성별 없다'... '남아' 선호 16%, '여아' 15%
· 남아 선호 상위국: 인도 39%, 필리핀 35%, 에콰도르·중국 24%, 영국 21%...
· 여아 선호 상위국: 한국 28%, 일본·스페인·필리핀 26%, 방글라데시 24%...
· 선호 격차 큰 나라: 인도(남아 우위), 방글라데시, 파키스탄, 한국, 일본(이상 여아)
[한국] '남아' 15%, '여아' 28%, '상관없음' 56%
· 한국인의 남아 선호 1992년 58%에서 2024년 15%로 감소
· 전 연령대 성별 무관 견해 우세, 60대 이상에서만 남·여아 선호 비슷
· 50대 이하는 여아 더 원해, 특히 30·40대 여성은 절반 육박
조사 결과
────────────
아이를 한 명만 가질 수 있다면 어떤 성별을 원하십니까?
────────────
44개국 시민 65% '상관없음'... '남아' 16%, '여아' 15%
- 남아 선호 상위국: 인도 39%, 필리핀 35%, 에콰도르·중국 24%, 영국 21%...
- 여아 선호 상위국: 한국 28%, 일본·스페인·필리핀 26%, 방글라데시 24%...
2024년 10월부터 2025년 2월까지 갤럽 인터내셔널이 44개국 성인 44,783명에게 아이를 한 명만 가질 수 있다면 어떤 성별을 원하는지 물었다. 그 결과 65%는 성별 상관없다고 답했고, 16%는 남아, 15%는 여아를 원했다. 4%는 의견을 유보했다.
◎ 대부분 국가에서 특별히 원하는 자녀 성별 없다는 견해가 우세하며, 멕시코(84%), 조지아(82%), 덴마크·스웨덴(81%)에서는 그 비율이 80%를 넘었다. 남아 선호 상위 5개국은 인도(39%), 필리핀(35%), 에콰도르·중국(24%), 영국(21%), 여아 선호 상위 5개국은 한국(28%), 일본·스페인·필리핀(26%), 방글라데시(24%)다.
◎ 44개국 중 5개 나라에서는 남·여아 선호 격차가 10%포인트를 넘었다. 인도는 남아(39%: 여아 11%) 선호가 28%포인트 앞섰고, 방글라데시(6%:24%), 파키스탄(7%:23%), 한국(15%:28%), 일본(14%:26%)은 여아 선호가 12~18%포인트 많았다.
─
한국인의 남아 선호 1992년 58%에서 2024년 15%로 감소
한국 조사는 2024년 11월 11~25일 전국(제주 제외) 만 19세 이상 1,534명을 대상으로 했다. 한국인은 전 연령대에서 자녀 성별 무관 견해가 우세한 가운데, 60대 이상에서만 남·여아(23%·20%) 선호가 비슷하고 50대 이하는 여아를 더 원했다. 성·연령별로 보면 특히 30·40대 여성의 여아 선호(40%대) 경향이 두드러졌다.
◎ 1992년(20세 이상 1,500명) 동일 질문에는 한국인의 58%가 아들, 10%가 딸을 택했고 32%가 성별 상관없다고 답했다. 당시 연령별 아들 선호 비율은 20대 42%, 30대 54%, 40대 65%, 50대 이상 79%였다. 30여 년 전 20대는 2024년 대부분 50대가 되었고, 그들의 선호 자녀 성별은 남아 14%, 여아 28%, 무관 57%로 바뀌었다.
참고로, '결혼하면 아들이 꼭 있어야 한다'는 의견은 1995년(20세 이상 523명) 45%에서 2008년(19세 이상 534명) 24%로 줄었다(→ G20080901).
◎ 1990~2023년 우리나라 출생성비(여아 100명당 남아)는 1990년 116.5명(최고), 1992년 113.6명, 2000년 110.1명, 2005년 107.8명, 2008년 106.4명, 2023년 105.1명이다(→ 통계청). 2000년까지 110명을 웃돌다가 2008년 이후로는 자연 성비 범위(103~107명)에 든다.
──────────────────
Majority Worldwide Say Child’s Gender Does Not Matter—
Yet Regional and Social Divides Persist
──────────────────
A global end-of-year survey conducted across 44 countries with nearly 45,000 respondents reveals that attitudes toward gender preference in children are shifting toward greater neutrality. When asked: "Suppose you could have only one child. Would you prefer that it be a boy or a girl, or is gender irrelevant?", the majority globally (65%) indicated that gender is irrelevant. However, deeper analysis shows that this neutrality is not evenly distributed.
The global survey was conducted in between October 2024 and February 2025 among 44,783 scientifically selected men and women, on average a sample of 1000 in each polled nation.
KEY FINDINGS
The key findings from the survey data are the following:
1. Country-wise differences:
Country-wise breakdown reveals stark contrasts in gender preference across countries. The top five nations with the highest preference for a boy child are India (39%), Philippines (35%), Ecuador (24%), China (24%), and United Kingdom (21%). On the other hand, the highest preference for a girl child was recorded in Republic of Korea (28%), Japan (26%), Spain (26%), Philippines (26%) and Bangladesh (23%). Meanwhile, gender neutrality was most strongly expressed in Mexico (84%), Georgia (82%), Denmark (81%), Sweden (81%), and Armenia (78%).
2. Gender differences:
The survey found distinct differences between men and women. Men were more likely to prefer having a boy (20%) compared to women (12%). Conversely, 19% of women expressed a preference for having a girl, while only 12% of men said the same. Despite these variations, a majority in both groups—66% of women and 64% of men—indicated that the gender of the child is irrelevant, showing that gender neutrality is now the dominant view across genders.
3. Education differences:
Education was a strong predictor of gender-neutral views. Respondents with low education had the highest preference for boys (17%). In contrast, those with higher education were significantly more likely to say that gender does not matter (65%).
4. National income differences:
National income levels also influenced preferences. In low-income countries, 19% of respondents still preferred a boy, and only 61% said gender is irrelevant. In contrast, middle-income countries reported 16% boy preference, with 66% indicating gender neutrality. High-income countries showed the lowest boy preference (14%) and indifference to child gender (66%), indicating that economic development correlates with more egalitarian views.
5. Regional differences:
Regional differences were particularly striking. Preference for boys was highest in Southeast Asia (24%), followed by the Arab World (20%), and North America (20%). Western and Eastern Europe reported the lowest boy preferences at 13% and 12% respectively. When it came to preference for girls, Northeast Asia led with 25%, followed by South Asia at 18%. Western Europe also stood out, with 16% of respondents expressing a preference for a girl. Gender-neutral responses were most common in Eastern Europe (71%), followed by Western Europe (68%), Latin America, Africa and West Asia (66% each), and the Arab World (64%) and North America (62%). In contrast, gender neutrality was lowest in Northeast Asia (53%) and Southeast Asia (54%).
These findings suggest that while the world is moving towards greater gender equality in family preferences, deep-rooted cultural and socio-economic factors continue to shape individual attitudes. Traditional preferences—particularly for boys—remain strong in some regions, especially where educational and economic indicators are lower.
Commentary on poll findings by
Michael Nitsche, President Gallup International Association in Vienna, Johny Heald, Board Member GIA in London and Bilal Gilani, Board Member GIA in Islamabad:
“The survey highlights both encouraging signs of progress and enduring cultural norms. While a majority globally embrace gender neutrality, targeted efforts are still needed to address persistent biases—especially in regions and demographic groups where boy preference remains high.”
───
한국 응답자 특성표