- 국외 이주 의향 여부 - Gallup International 다국가 조사 #75주년 #이민
- 조사일 : 2022/10/31
- [GallupReport(20230216)_Migration_GIA75.pdf] 다운로드
● 2023년 2월 16일(목) 공개 | 문의: 02-3702-2571/2621/2622
국외 이주 의향 여부 - Gallup International 75주년 다국가 조사
→ 한국+세계 조사 결과 파일 다운로드(PDF)
/ 세계 조사 개요
- 2022년 8~10월 57개국 성인 총 54,329명 전화/온라인/면접조사(주제별 참여국 상이)
/ 한국 조사 개요
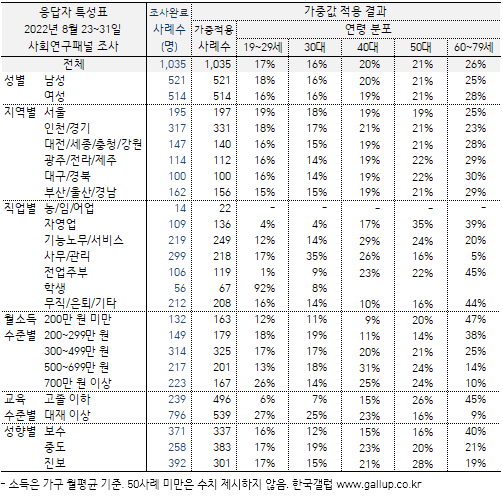
- 조사기간: 2022년 8월 23~31일
- 표본추출: 사회연구패널★에서 성·연령·지역별 층화 추출
(한국갤럽이 무선전화 RDD 방식으로 구축·운영하는 확률 기반 조사패널)
- 응답방식: 모바일조사(조사대상자에게 문자메시지 발송, 자기기입식 웹조사)
- 조사대상: 전국 만 19~79세 1,035명
- 표본오차: ±3.0%포인트(95% 신뢰수준)
- 문자 발송 대비 응답 완료율: 46%(총 2,263명 중 1,035명)
- 의뢰처: 한국갤럽-Gallup International 자체 조사
요약
- 57개국 시민 중 36% '요건 충족 시 다른 나라에서 살고 싶다'
/ 이주 의향자 많은 나라: 시에라리온 84%, 가나 81%, 나이지리아 71%, 시리아 61% 순
/ 이주 의향자 적은 나라: 인도 4%, 베트남 8%, 일본 14%, 러시아 15% 등
- 저소득 국가, 젊은이들 국외 이주 의향 많은 편
/ 사하라 이남 아프리카 56%, 라틴 아메리카 54%, 서아시아 46%
/ 34세 이하 44%, 35~54세 34%, 55세 이상 23%
- 한국 20·30대 여성 국외 이주 의향 50% 웃돌아, 또래 남성은 30% 내외
/ 40~70대는 넷 중 한 명꼴, 성별 차이 없어
조사 결과
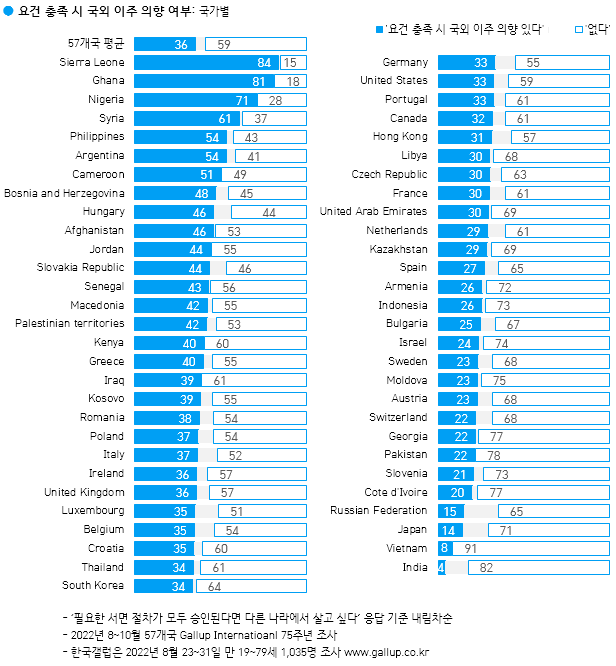
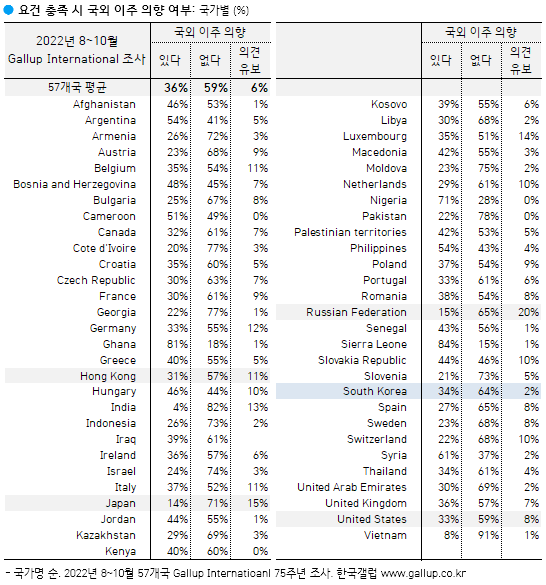
2022년 8~10월 57개국 시민 36%
'요건 충족 시 다른 나라에서 살고 싶다'
- 저소득 국가, 젊은이들 국외 이주 의향 많은 편
갤럽 인터내셔널이 2022년 8~10월 57개국 시민 54,329명에게 필요한 서면 절차가 모두 승인된다면 다른 나라에서 살고 싶은지 물은 결과, 36%가 그럴 의향 있음을 밝혔다. 59%는 요건이 충족되더라도 지금 사는 곳에서 계속 머물겠다고 답했고, 2%는 의견을 유보했다.
◎ 연령별로 보면 젊은이들이 대체로 자국을 떠나려는 경향이 강했다. 57개국 34세 이하 시민 중에서는 절반에 가까운 44%가 다른 나라에서 살고 싶다고 답했지만, 그 비율이 35~54세에서는 34%, 55세 이상에서는 23%로 낮아졌다.
◎ 국외 이주 의향자가 많은 나라는 시에라리온 84%, 가나 81%, 나이지리아 71%, 시리아 61% 순이며, 인도(4%), 베트남(8%), 일본(14%), 러시아(15%) 등에서는 자국을 떠나려는 사람이 20%를 넘지 않았다. 일본을 제외한 G7 국가의 국외 이주 의향자 비율은 30%대로 57개국 평균 수준이다: 이탈리아 37%, 영국 36%, 미국·독일 33%, 캐나다 32%, 프랑스 30%.
◎ 권역별 국외 이주 의향 기준으로 보면 사하라 이남 아프리카(56%), 라틴 아메리카(54%), 서아시아(46%) 등에서 세계 평균을 웃돌았다. 이들 지역에는 상대적으로 저소득 국가가 다수 포함되어 있다. 국가별 경제적 상황은 응답자의 개인 소득, 직업, 교육 수준보다 국외 이주 의향과 뚜렷한 연관성을 보였다. 하지만 이주 의향자가 적은 인도, 베트남, 일본, 러시아 등의 사례는 국가 경제력보다 문화적 정체성이 더 강력한 영향 요인일 수 있음을 보여준다.
──
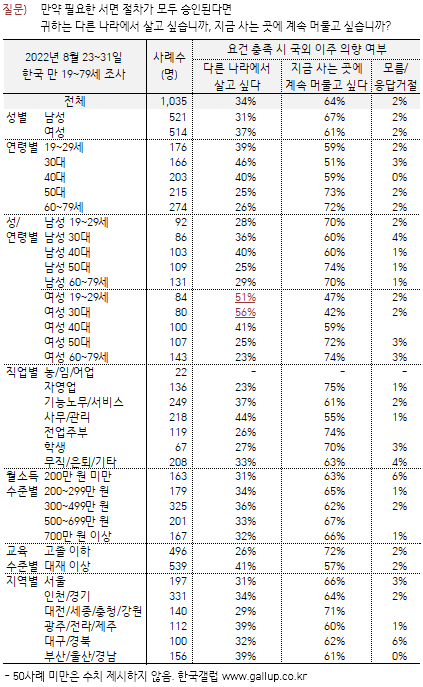
한국인 34%, '요건 충족 시 다른 나라에 살고 싶다'
- 40~70대 넷 중 한 명 국외 이주 의향, 20·30대 여성은 50% 웃돌아
한국인 중에서는 34%가 '요건 충족 시 다른 나라에 살고 싶다'고 답했고, 50~70대(20%대 중반)보다 20~40대(40% 내외) 중에 이주 의향자가 더 많았다. 성·연령별로 보면 20·30대 여성의 국외 이주 의향 응답은 50%를 웃돌았고, 같은 연령대 남성은 30% 내외로 달랐다. 40대 이상에서는 성별 차가 없었다.
──────────────────
One in three global citizens want to immigrate
──────────────────
36% around the world willing to migrate. As expected, especially young people from difficult economic background are among potential migrants. Majorities of readiness are observed in Sub-Saharan Africa and Latin America.
This is the result of an opinion poll conducted by GIA in 57 countries covering about two thirds of the global population (and about 90% of those countries which are free to conduct and publish opinion research).
36% of global citizens said yes when asked "If you were given all the necessary paperwork, would you like to live in another country or would you prefer to remain where you are?“, 59% answered they would like to stay where they are and remaining did not answer the question.
Younger population significantly more eager to leave their current country. Almost one in two (44%) young people surveyed (those below age 34) said if given the option they would like to live in another country. The figure for young was almost 8 points higher than the average and 21 points higher than older respondents (classified as those above age 55) of which only 23% said they would like to live elsewhere.
Lower Income country respondents significantly more likely to express motivation to emigrate. 62% of respondents surveyed in low-income countries (those classified by World Bank as earning less than 1085 USD per year or less) expressed motivation to live in another country. The motivation seems to drop as the country one lives in prospers. Among high income countries the motivation to migrate was found to be around 32% (half that of the poorest countries).
The analysis reveals that respondents’ own income, education or occupation profile makes little difference in willingness or motivation to migrate. The general income of the country had a significant implication, however in this regard.
Among different regions of the world, willingness to migrate to another country was found to be highest in Sub Saharan Africa (where 56% of respondents surveyed expressed their wish to migrate to another country). This was followed by Latin America (54%). The lowest willingness to migrate was found in South Asia.
Top countries in terms of willingness to migrate were: Sierra Leone (84%), Ghana (81%) and Nigeria (71%). Lowest willingness was registered in India (4%), Vietnam (8%), Japan (14%), etc.
Kancho Stoychev,
President of Gallup International Association:
“The registered fact that an average of more than every third inhabitant of the studied 57 countries is willing to emigrate is more than significant. The reasons to change the state where you live are for sure various and countries comparisons are maybe not quite appropriate. Obviously the economic circumstances dominate such a decision but by far they are not the only ones. It seems indeed that a very strong cultural identity is the most powerful factor for the opposite – not to emigrate. That is why we register a significantly lower levels of such intentions in countries like India, Vietnam, Japan and Russia.”
──
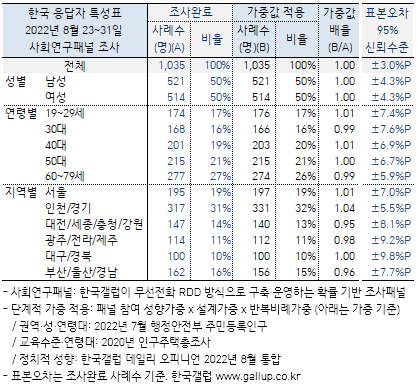
한국 응답자 특성표
| 1947년 조지 갤럽 박사가 설립한 갤럽 인터내셔널(Gallup International Association)은 매년 전 세계 회원사 공동으로 주요 현안에 관한 여론을 조사합니다. 2022년 가을에는 설립 75주년을 기념하는 조사를 했고, 올해 상반기 몇 차례에 걸쳐 그 결과를 전하고 있습니다. 지난번 〈경제·안보 전략적 파트너〉 〈현세대 삶 평가, 다음 세대 삶 전망〉에 이어, 오늘은 국외 이주 의향 여부를 알려드립니다. → Press release for the 120th Anniversary of Dr. George Gallup |
국외 이주 의향 여부 - Gallup International 75주년 다국가 조사
→ 한국+세계 조사 결과 파일 다운로드(PDF)
/ 세계 조사 개요
- 2022년 8~10월 57개국 성인 총 54,329명 전화/온라인/면접조사(주제별 참여국 상이)
/ 한국 조사 개요
- 조사기간: 2022년 8월 23~31일
- 표본추출: 사회연구패널★에서 성·연령·지역별 층화 추출
(한국갤럽이 무선전화 RDD 방식으로 구축·운영하는 확률 기반 조사패널)
- 응답방식: 모바일조사(조사대상자에게 문자메시지 발송, 자기기입식 웹조사)
- 조사대상: 전국 만 19~79세 1,035명
- 표본오차: ±3.0%포인트(95% 신뢰수준)
- 문자 발송 대비 응답 완료율: 46%(총 2,263명 중 1,035명)
- 의뢰처: 한국갤럽-Gallup International 자체 조사
요약
- 57개국 시민 중 36% '요건 충족 시 다른 나라에서 살고 싶다'
/ 이주 의향자 많은 나라: 시에라리온 84%, 가나 81%, 나이지리아 71%, 시리아 61% 순
/ 이주 의향자 적은 나라: 인도 4%, 베트남 8%, 일본 14%, 러시아 15% 등
- 저소득 국가, 젊은이들 국외 이주 의향 많은 편
/ 사하라 이남 아프리카 56%, 라틴 아메리카 54%, 서아시아 46%
/ 34세 이하 44%, 35~54세 34%, 55세 이상 23%
- 한국 20·30대 여성 국외 이주 의향 50% 웃돌아, 또래 남성은 30% 내외
/ 40~70대는 넷 중 한 명꼴, 성별 차이 없어
조사 결과
2022년 8~10월 57개국 시민 36%
'요건 충족 시 다른 나라에서 살고 싶다'
- 저소득 국가, 젊은이들 국외 이주 의향 많은 편
갤럽 인터내셔널이 2022년 8~10월 57개국 시민 54,329명에게 필요한 서면 절차가 모두 승인된다면 다른 나라에서 살고 싶은지 물은 결과, 36%가 그럴 의향 있음을 밝혔다. 59%는 요건이 충족되더라도 지금 사는 곳에서 계속 머물겠다고 답했고, 2%는 의견을 유보했다.
◎ 연령별로 보면 젊은이들이 대체로 자국을 떠나려는 경향이 강했다. 57개국 34세 이하 시민 중에서는 절반에 가까운 44%가 다른 나라에서 살고 싶다고 답했지만, 그 비율이 35~54세에서는 34%, 55세 이상에서는 23%로 낮아졌다.
◎ 국외 이주 의향자가 많은 나라는 시에라리온 84%, 가나 81%, 나이지리아 71%, 시리아 61% 순이며, 인도(4%), 베트남(8%), 일본(14%), 러시아(15%) 등에서는 자국을 떠나려는 사람이 20%를 넘지 않았다. 일본을 제외한 G7 국가의 국외 이주 의향자 비율은 30%대로 57개국 평균 수준이다: 이탈리아 37%, 영국 36%, 미국·독일 33%, 캐나다 32%, 프랑스 30%.
◎ 권역별 국외 이주 의향 기준으로 보면 사하라 이남 아프리카(56%), 라틴 아메리카(54%), 서아시아(46%) 등에서 세계 평균을 웃돌았다. 이들 지역에는 상대적으로 저소득 국가가 다수 포함되어 있다. 국가별 경제적 상황은 응답자의 개인 소득, 직업, 교육 수준보다 국외 이주 의향과 뚜렷한 연관성을 보였다. 하지만 이주 의향자가 적은 인도, 베트남, 일본, 러시아 등의 사례는 국가 경제력보다 문화적 정체성이 더 강력한 영향 요인일 수 있음을 보여준다.
──
한국인 34%, '요건 충족 시 다른 나라에 살고 싶다'
- 40~70대 넷 중 한 명 국외 이주 의향, 20·30대 여성은 50% 웃돌아
한국인 중에서는 34%가 '요건 충족 시 다른 나라에 살고 싶다'고 답했고, 50~70대(20%대 중반)보다 20~40대(40% 내외) 중에 이주 의향자가 더 많았다. 성·연령별로 보면 20·30대 여성의 국외 이주 의향 응답은 50%를 웃돌았고, 같은 연령대 남성은 30% 내외로 달랐다. 40대 이상에서는 성별 차가 없었다.
──────────────────
One in three global citizens want to immigrate
──────────────────
36% around the world willing to migrate. As expected, especially young people from difficult economic background are among potential migrants. Majorities of readiness are observed in Sub-Saharan Africa and Latin America.
This is the result of an opinion poll conducted by GIA in 57 countries covering about two thirds of the global population (and about 90% of those countries which are free to conduct and publish opinion research).
36% of global citizens said yes when asked "If you were given all the necessary paperwork, would you like to live in another country or would you prefer to remain where you are?“, 59% answered they would like to stay where they are and remaining did not answer the question.
Younger population significantly more eager to leave their current country. Almost one in two (44%) young people surveyed (those below age 34) said if given the option they would like to live in another country. The figure for young was almost 8 points higher than the average and 21 points higher than older respondents (classified as those above age 55) of which only 23% said they would like to live elsewhere.
Lower Income country respondents significantly more likely to express motivation to emigrate. 62% of respondents surveyed in low-income countries (those classified by World Bank as earning less than 1085 USD per year or less) expressed motivation to live in another country. The motivation seems to drop as the country one lives in prospers. Among high income countries the motivation to migrate was found to be around 32% (half that of the poorest countries).
The analysis reveals that respondents’ own income, education or occupation profile makes little difference in willingness or motivation to migrate. The general income of the country had a significant implication, however in this regard.
Among different regions of the world, willingness to migrate to another country was found to be highest in Sub Saharan Africa (where 56% of respondents surveyed expressed their wish to migrate to another country). This was followed by Latin America (54%). The lowest willingness to migrate was found in South Asia.
Top countries in terms of willingness to migrate were: Sierra Leone (84%), Ghana (81%) and Nigeria (71%). Lowest willingness was registered in India (4%), Vietnam (8%), Japan (14%), etc.
Kancho Stoychev,
President of Gallup International Association:
“The registered fact that an average of more than every third inhabitant of the studied 57 countries is willing to emigrate is more than significant. The reasons to change the state where you live are for sure various and countries comparisons are maybe not quite appropriate. Obviously the economic circumstances dominate such a decision but by far they are not the only ones. It seems indeed that a very strong cultural identity is the most powerful factor for the opposite – not to emigrate. That is why we register a significantly lower levels of such intentions in countries like India, Vietnam, Japan and Russia.”
──
한국 응답자 특성표